At its meeting today, the Board decided to leave the cash rate unchanged at 1.50 per cent.

There was a broad-based pick-up in the global economy in 2017. A number of advanced economies are growing at an above-trend rate and unemployment rates are low. Growth has also picked up in the Asian economies, partly supported by increased international trade. The Chinese economy continues to grow solidly, with the authorities paying increased attention to the risks in the financial sector and the sustainability of growth.

The pick-up in the global economy has contributed to a rise in oil and other commodity prices over recent months. Even so, Australia’s terms of trade are expected to decline over the next couple of years, but remain at a relatively high level.

Globally, inflation remains low, although higher commodity prices and tight labour markets are likely to see inflation increase over the next couple of years. Long-term bond yields have risen but are still low. As conditions have improved in the global economy, a number of central banks have withdrawn some monetary stimulus. Financial conditions remain expansionary, with credit spreads narrow.

The Bank’s central forecast for the Australian economy is for GDP growth to pick up, to average a bit above 3 per cent over the next couple of years. The data over the summer have been consistent with this outlook. Business conditions are positive and the outlook for non-mining business investment has improved. Increased public infrastructure investment is also supporting the economy. One continuing source of uncertainty is the outlook for household consumption. Household incomes are growing slowly and debt levels are high.

Employment grew strongly over 2017 and the unemployment rate declined. Employment has been rising in all states and has been accompanied by a significant rise in labour force participation. The various forward-looking indicators continue to point to solid growth in employment over the period ahead, with a further gradual reduction in the unemployment rate expected. Notwithstanding the improving labour market, wage growth remains low. This is likely to continue for a while yet, although the stronger economy should see some lift in wage growth over time. There are reports that some employers are finding it more difficult to hire workers with the necessary skills.

Inflation is low, with both CPI and underlying inflation running a little below 2 per cent. Inflation is likely to remain low for some time, reflecting low growth in labour costs and strong competition in retailing. A gradual pick-up in inflation is, however, expected as the economy strengthens. The central forecast is for CPI inflation to be a bit above 2 per cent in 2018.

On a trade-weighted basis, the Australian dollar remains within the range that it has been in over the past two years. An appreciating exchange rate would be expected to result in a slower pick-up in economic activity and inflation than currently forecast.

Nationwide measures of housing prices are little changed over the past six months, with prices having recorded falls in some areas. In the eastern capital cities, a considerable additional supply of apartments is scheduled to come on stream over the next couple of years. To address the medium-term risks associated with high and rising household indebtedness, APRA introduced a number of supervisory measures. Tighter credit standards have also been helpful in containing the build-up of risk in household balance sheets.

The low level of interest rates is continuing to support the Australian economy. Further progress in reducing unemployment and having inflation return to target is expected, although this progress is likely to be gradual. Taking account of the available information, the Board judged that holding the stance of monetary policy unchanged at this meeting would be consistent with sustainable growth in the economy and achieving the inflation target over time.


Source: Reserve Bank of Australia, February 6th, 2018

Enquiries

Media and Communications
Secretary’s Department
Reserve Bank of Australia
SYDNEY

Phone: +61 2 9551 9720
Fax: +61 2 9551 8033

2017 was unusual for US shares. While Japanese, European and Australian shares had decent corrections throughout the year of around 5 to 7%, the US share market as measured by the S&P 500 saw only very mild pullbacks of less than 3%. This was against the backdrop of a strongly rising trend thanks to very positive economic conditions and President Trump’s business friendly policies. In fact, up to its high a week ago it went a record 310 days without a 3% or greater pullback and every month last year saw a positive total return (ie capital growth plus dividends) which is also unusual. This, combined with a very strong start to this year of 7.5%, very high levels of short-term investor optimism and lots of talk of a “melt up” left the US share market overbought and highly vulnerable to a correction, which we may now be starting to see.

The past week has seen shares come under pressure as Fed rate hike expectations increased, partly reflecting an acceleration in US wages growth, and the bond yield rose sharply. From their recent high, US shares have fallen 3.9% making it the deepest pullback since a 4.8% fall prior to the November 2016 US election. It’s likely the pullback has further to go as investors adjusts to more Fed tightening than currently assumed – we see four (or possibly five) Fed rate hikes this year against market expectations for three – and higher bond yields.

This will impact most major share markets, including the Australian share market which is vulnerable given its high exposure to yield plays like real estate investment trusts and utilities. However, the pullback is likely to be just an overdue correction (with say a 10% or so fall) rather than a severe bear market – providing the rise in bond yields is not too abrupt and recession is not imminent in the US with profits continuing to rise. So the two key questions are how severe the back up in bond yields will be and whether a recession is approaching?

How severe will the back up in bond yields be?

We had a look at this issue last week in Higher global inflation and higher global bond yields. With global inflation risks rising, bond yields running well below long-term sustainable levels, bonds subject to the reversal of huge fund inflows in recent years and central bank bond buying starting to slow, the trend in bond yields is likely to be up. But notwithstanding periodic spikes, the rising trend in bond yields is likely to be gradual as historically it will take a while for inflation expectations to turn up significantly after a long downswing, the Fed is still likely to be “gradual” in raising rates and central banks outside the US remain a fair way off monetary tightening. Also, global inflation is unlikely to take off too quickly given spare capacity outside the US, technological innovation will continue to act as a drag on inflation and inflation expectations are well anchored compared to say the 1970s, 80s and 90s.

Today is very different from 1994, when US shares corrected 9% and Australian shares fell 22% as bond yields rose over 200 basis points in the US in less than a year and 400 basis points in Australia as the Fed doubled the Fed Funds rate from 3% to 6% in 12 months and the Reserve Bank of Australia (RBA) hiked the cash rate from 4.75% to 7.5% over 6 months. Thanks to higher debt levels and more constrained underlying growth, the Fed and RBA won’t be able to raise rates anywhere near like that and RBA hikes are unlikely until late this year at the earliest.

Is the US economy headed for recession?

This is a critical question as the US share market invariably sets the direction for global shares including the Australian share market and historical experience tells us that slumps in shares tend to be shallower and/or shorter when there is no US recession and deeper and longer when there is (eg, the tech wreck and the Global Financial Crisis). The next table shows US share market falls greater than 10% since the 1970s. I know the latest fall is far less than that, but I haven’t shown falls less than 10% because there are so many of them – in other words 5% or so pullbacks are a dime a dozen, ie, normal! The first column shows the period of the fall, the second shows the decline in months, the third shows the percentage decline from top to bottom, the fourth shows whether the decline was associated with a recession or not, the fifth shows the gains in the share market one year after the low and the final column shows the decline in the calendar year associated with the share market fall. Falls associated with recessions are highlighted in red. Averages are shown for the whole period and for falls associated with recession at the bottom of the table.

Several points stand out.

First, share market falls associated with recession tend to last longer with an average fall lasting 16 months as opposed to 9 months for all 10% plus falls.

Second, falls associated with recession also tend to be deeper with an average decline of 36% compared to an average of 17% for all 10% plus falls.

Third, falls associated with recessions are more likely to be associated with negative total returns (ie capital growth plus dividends) in the associated calendar year as a whole with an average total loss of 8% compared to an average total return of 6% across all calendar years associated with 10% plus falls.

Finally, as would be expected the share market rebound in the year after the low is much greater following share market falls associated with recession.


Falls associated with recessions are in red. Source: Bloomberg, AMP Capital.

So whether a recession is imminent or not in the US is critically important in terms of whether we will see a major bear market or not. In fact, the same applies to Australian shares.

Our assessment is that recession is not imminent in the US. We will look at this in more detail in a subsequent note, but the key reasons are that:

  • The post-GFC hangover has only just faded with high levels of confidence helping drive stronger investment and consumer spending. 

  • While US monetary conditions are tightening they are still easy. The Fed Funds rates of 1.25 – 1.5% is still well below nominal growth of just over 4%. The yield curve is still positive and in fact has been steepening lately as long-term bond yields have been rising relative to short-term interest rates, whereas recessions are normally preceded by negative yield curves.

  • Tax cuts and their associated fiscal stimulus are likely to boost US growth at least for the next 12 months.

  • We have not seen the excesses – massive debt growth, overinvestment, capacity constraints or excessive inflation – that normally precede recessions.

As a result, earnings growth is likely to remain strong in the year ahead. The December quarter US earnings reporting season is coming in much stronger than expected with profits up around 14.5% year on year and revenue up 8%. And earnings growth expectations for this year have recently pushed up to 16% as tax cuts get factored in.

But what about the long-awaited pickup in US wages growth (up from around 2.5% year on year to around 2.9% so far)? Surely that must be bad for profits? Actually, the historical experience points to rising wages growth as being positive for profits as it drives stronger spending – until of course it turns into an inflation problem prompting tight monetary policy – but we are still a long way from that.

Conclusion

So for these reasons the pullback in the direction-setting US share market should be limited in depth and duration to a correction and we remain of the view that returns from shares will be positive this year. However, it’s increasingly clear that it’s going to be a more volatile year than last year and that share market sectors that are sensitive to rising interest rates and bond yields are likely to remain relative underperformers.

Important note: While every care has been taken in the preparation of this article, AMP Capital Investors Limited (ABN 59 001 777 591, AFSL 232497) and AMP Capital Funds Management Limited (ABN 15 159 557 721, AFSL 426455) makes no representations or warranties as to the accuracy or completeness of any statement in it including, without limitation, any forecasts. Past performance is not a reliable indicator of future performance. This article has been prepared for the purpose of providing general information, without taking account of any particular investor’s objectives, financial situation or needs. An investor should, before making any investment decisions, consider the appropriateness of the information in this article, and seek professional advice, having regard to the investor’s objectives, financial situation and needs. This article is solely for the use of the party to whom it is provided.

The so called ‘yield trade’, which has pushed valuations in the Australian real estate market across the various segments right up to their long term averages, will continue in 2018.

Even though this ‘search for yield’ phenomenon has been playing out for some years – while interest rates remain low and investors to be pushed into riskier assets in search of income – the real estate segment is still fairly priced overall and there are even some pockets of value for discerning investors.

For instance, high quality CBD commercial assets still offer well-placed investors strong outperformance potential.

Meanwhile, the arrival of ecommerce players in the retail segment is boosting demand for industrial spaces in inner urban areas.

Finally, ahead-of-the-curve shopping centers building out multi-purpose social infrastructure finding demand from new mix of tenants.

Office Sector

Investors are becoming increasingly competitive in their desire to secure high quality, core assets in growth markets. Sydney and Melbourne have benefitted from this, however Brisbane and even Perth have not been immune to ‘weight of money’ driven capital appreciation.

Fortunately, in some markets, tenant demand has kept pace with capital deployed, meaning that mispricing is less likely and fair value is still being paid.

Markets with economies aligned to financial services, business services, technology and government have prospered in this cycle. However we are now seeing resource led states such as Western Australia and Queensland exhibiting signs, albeit small ones, of a sustained recovery.

Overall in the office segment we’re seeing demand to rising due to low unemployment and and business confidence.

We’re also seeing a flight to quality in the office segment – investors are aggressively pricing quality and long-term cash flows.

We’re factoring in a National Effective Rental growth in the office segment of 5 per cent p.a. for the next three years led by Sydney and Melbourne with Brisbane to improve.

Retail Sector

Our in depth, asset and consumer level research tells us that shopping centres that can be expanded to capture market share, offer experiential services, improve accessibility, and embrace ongoing vibrancy, will be well positioned for rental growth during the current period of structural change.

The recent launch of Amazon in Australia and the introduction of Amazon Prime same day delivery within twelve months will have immediate implications for retails assets in Australia. AMP Capital has been proactively managing for this divergent environment and the repositioning of our major malls and the shift in our portfolio construction towards dominant experience malls, and local convenience malls is based on the longer term thematic “retail of the future” research.

Overall in the retail segment we’re seeing weaker sales growth as a result of lower wages and lower consumer sentiment.

But we’re expecting online sales to grow as share of all retail sales from 8% to 15% by 2020.  

We’re also seeing electronics, discount department stores and clothing retail categories under pricing pressure. 50% of tenants in centres today weren’t there five years ago.

Industrial sector

While the retail and the office sectors are facing headwinds from technology disruption, industrial property will benefit from rising logistics and e-commerce demand. Rising demand from domestic and global e-commerce operators will lift rents and take-up across highly populated east coast markets with well-located infrastructure.

With online sales forecast to increase significantly in the medium term this will provide favourable demand side conditions for inner urban fulfillment centres.

Overall in the industrial segment e-commerce will drive demand for new facilities  but supply level increases will be constrained by land scarcity.

Rental growth is still weak but it will improve in the medium term as vacancy rates falls and absorption rises due to increased demand.

We’re also expecting yields to compress further in 2018-19 as investors chase higher income growth.

In summary

As we approach the end of 2017, we are finishing the year with commercial real estate values continuing their upward trajectory.

While it’s true that the weight of money chasing real estate assets has pushed valuations up considerably in recent years, real estate remains in line with long-term averages overall.

For example, east coast prime office yields are over 280 basis points above the risk free rate, right in line with the 10 Year Government Bond yields at 2.8 per cent.

Even super prime real estate transactions in the range of 4.5 per cent to 5 per cent are still comfortably above long-term average spreads.

Australian real estate capital values are expected to continue to remain strong with the weight of capital showing few signs of abating in the near term but we are anticipating 2018 to be the peak of the cycle for capital value appreciation for real estate.

To read the full report click here


Source: AMP Capital 14 December 2017

Author: Luke Dixon, Head of Real Estate Research, AMP Capital


Did you know it takes 957 gallons of water to create a single Big Mac? Some 550 million Big Macs are consumed each year in the US alone. That’s a lot of water. But we simply wouldn’t have Big Macs without the infrastructure to filter and transport water to each part of the Big Mac production process.

It’s easy to forget that infrastructure is a vital cog in the items we consume every day in a dynamic and growing economy. Infrastructure is often viewed as old and boring, dangerous when rates rise, and relatively volatile.

But if we can deconstruct the three most pervasive and misleading myths around global listed infrastructure, investors, particularly retirees, will be less likely to dismiss an asset class that delivers them two powerful benefits: a defensive and stable yield for income, and also the capital growth needed to keep up with their rising costs of living.

MYTH 1: Infrastructure is a boring old-economy style investment

The first myth is that somehow in a world of Amazon, Uber and Google infrastructure is an ‘old economy’ style investment; it has little growth potential and limited relevance to future economic needs.

Nothing could be further from the truth. Indeed, McKinsey estimates that US$57 trillion will be spent on infrastructure worldwide by 2030. And infrastructure is at the core of many key global secular themes that are shaping the future of investment markets:

  • Communication and data usage. Our ability to deliver and enable the technology and communication needs for the new economy relies on infrastructure. Global mobile data traffic is expected to increase seven-fold between 2016 and 2021, according to CISCO.

  • Shale gas. Drillers have used fracking technologies to extract new sources of natural gas from previously uneconomic shale formations. That natural gas is helping meet the insatiable global demand for energy. We require some $A641 billion of investment in midstream energy infrastructure through to 2035, an annual spend of $A29 billion.

  • Electricity production and transmission. The production and delivery of an economic electricity supply will become increasingly important if we are to maintain global economic growth.

  • Water. Our ability to store and efficiently deliver a reliable water supply is becoming increasingly vital as the world’s population surges and global water distribution remains unpredictable. Agriculture currently uses around 70-80% of available water. That usage will rise as developing economies, such as China, increase consumption of meat, which requires significant volumes of water to produce. Indeed, some forecasts say that, by the year 2030, the global demand for water will exceed the global supply of water by an astounding 40%.

MYTH 2. Volatility in listed infrastructure is a disadvantage compared to unlisted infrastructure

A myth also persists that because global listed infrastructure (which can be bought and sold on exchanges) can be more volatile, it is therefore a worse investment than unlisted infrastructure.

Yes, unlisted infrastructure can be less volatile because assets are typically valued twice a year. But listed infrastructure’s daily pricing creates opportunity. An active manager can find arbitrage opportunities when economic growth slows and the value of listed infrastructure falls faster and more than unlisted assets.

Listing infrastructure on an exchange brings other benefits to investors, including diversification. Investors can access a broad set of liquid investment opportunities across geographies and sectors that may not be available through direct investment.

We believe that, ultimately, the returns from infrastructure are determined by the asset itself, and not by whether the asset is in the listed or unlisted format. In many cases, listed infrastructure companies and direct investors co-own assets and as a result, both formats should deliver similar returns in the long term.

MYTH 3. Infrastructure assets are susceptible to rate hikes

But perhaps the most pervasive myth is that infrastructure suffers when central banks increase interest rates. But the reality is that infrastructure assets typically provide protection against rising interest rates.

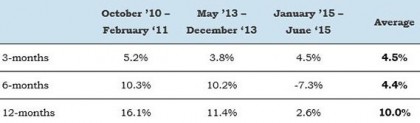
As we’ve noted previously, global listed infrastructure is sensitive to rate rises in the short-term. Since the end of the GFC, we have witnessed 4 periods of meaningful increases in sovereign yields. Global listed infrastructure initially underperformed global equities, but then, as you can see in the chart below, the asset class showed remarkable resilience and recovered all the relative underperformance over the next 12 months.

Table 1.  Relative performance following periods of rising yields – Global Listed Infrastructure vs. Global Equities 

Why is infrastructure rate rise resilient? Firstly, infrastructure companies’ longer-term debt structures gives them the option to refinance longer-term debt at favourable rates should market conditions allow. Secondly, when rates rise, infrastructure companies can  often charge customers more because contracts and regulation are often negotiated on a ‘cost-plus’ basis. And thirdly, when interest rates rise because of GDP growth, infrastructure assets are usually benefiting from increased demand in a buoyant economy.

Over the long term, investors should focus on global listed infrastructure’s ability to generate visible and growing cash flow, because that is ultimately what determines performance, not fluctuating rates.

A different story

More than ever investors, particularly retirees, need both stable income and growth, which is exactly what global listed infrastructure delivers.

Yet it is an asset class that is particularly prone to distorting myths, perhaps because it is relatively new. That creates a danger that investors don’t include it in their long-term portfolios.

But global listed infrastructure will continue to deliver income and growth, even as quantitative easing (QE) ends and interest rates rise, because of its strong cash flows and because it is the foundation of improving global growth.

People will still be eating Big Macs, and we’ll still need the gallons of water required to make the hamburgers, and most importantly we’ll still need the infrastructure that delivers that water.


Source: AMP Capital 14 December 2017

Two years after it first started raising interest rates in this cycle in December 2015, the Fed has increased rates for the fifth time, raising the Fed Funds rate another 0.25% to a target range of 1.25-1.5%. For the last two years, it has been right not to fear the Fed as tightening was conditional on better economic conditions, it would be gradual and we were only moving from very easy monetary policy to less easy. Despite a few ructions after the first move into early last year, this has been correct as the US and global recovery has accelerated and share markets and other growth assets have performed well. The question now is where to from here? Will the Fed get more aggressive? Should investors be more concerned?

Fed hike number 5

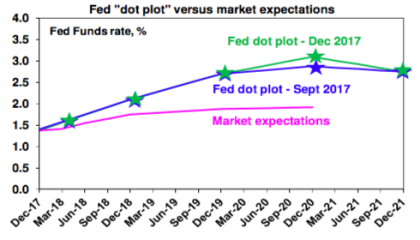
In raising the target range for the Fed Funds rate by another 0.25%, the Fed noted the continuing strengthening in the US labour market and solid growth and continues to expect inflation to pick up towards its 2% target. The Fed continues to refer to only “gradual” increases in interest rates going forward and the Fed’s so-called “dot plot” median of Fed meeting participants’ interest rate expectations is continuing to allow for three hikes in 2018 (the same as flagged in the September meeting). Quite clearly the Fed is confident that growth will remain strong with tax cuts providing an additional stimulus – it revised up its 2018 growth forecast from 2.1% to 2.5% – and that this will start pushing inflation back towards the 2% target. 

The transition to new leadership at the Fed in March from Janet Yellen to Jerome Powell (assuming he is confirmed by the Senate, which is most likely) isn’t expected to signal a big change at the Fed on monetary policy. Powell is likely to follow the broad path the Fed is already on in terms of rates hikes and quantitative tightening. There may be a more relaxed approach to regulation, though, but for now that’s a separate issue.

Market expectations for just two Fed rates in 2018 hikes remain below the Fed’s dot plot signal of three hikes. While the market has been right in expecting lower interest rates than the Fed has been signalling in recent years, it wrongly underestimated the Fed in 2017 and is likely to do so again 2018. I suspect that the risks for US inflation are now swinging to the upside with spare capacity in the US economy gradually diminishing. So just as the market proved too cautious in allowing for just two Fed hikes this year when it has actually done three, we suspect it will be surprised again next year. In fact, given our views of a pick-up in inflation risks, we are allowing for four rate hikes next year in 2018 (conditional on tax reform being passed).


Source: US Federal Reserve, AMP Capital

Will the Fed start to become a problem for markets?

It’s still too early to get too concerned about the Fed.

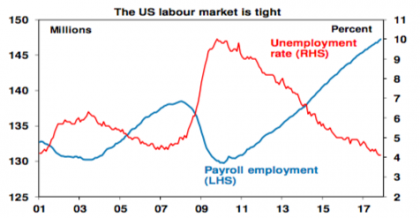
  • First, the Fed is only tightening because the US economy is strong. Confidence is high, business investment is improving, the labour market is tight and profits are strong. And future rate increases will remain conditional on the economy continuing to improve.


Source: Bloomberg, AMP Capital

  • Second, for now at least, Fed rate hikes can remain “gradual” as there is still some slack remaining and inflation is currently still low.

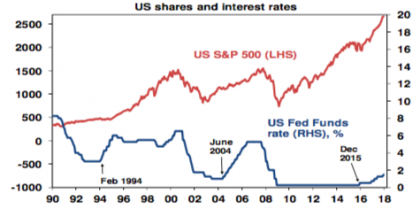
  • Third, US economic downturns have historically only come three years after the first Fed rate hike in a tightening cycle. And it’s likely to be even longer this time as it’s only when monetary policy becomes tight after numerous hikes that the economy gets hit and we are still a long way from that – so the gradual nature of the rate hikes so far could stretch it out further. In the last tightening cycle in 2004-2006, rates rose 17 times in just over two years – now they have only gone up five times over two years and from a much easier base. Shares often have wobbles around the first rate hike – as we saw in second half 2015 and early 2016 – but again, sustained problems usually only set in when monetary policy has become tight. This can be seen in the next chart. Shares had wobbles when interest rates first started to move up in February 1994 and in June 2004. Thereafter they resumed their rising trends and bear markets did not set in till 2000 and 2007 after multiple hikes and with recessions looming. Again, we are a long way from that.


Source: Bloomberg, AMP Capital

  • Finally, other major countries – Europe, Japan and Australia – are a long way from monetary tightening. So global monetary conditions remain very easy. 

However, we are now two years into tightening and the Fed might cause a few gyrations in the year ahead.

  • The risks around inflation in the US are rising. The US labour market is even tighter than it was a year ago with most indicators pointing to very tight conditions – unemployment near 4%, ultra-low jobless claims, very high hiring and quits rates, business surveys indicating high employment plans, etc – and anecdotal evidence continuing to point to rising wages. Sooner or later this will show in higher official wage data with some flow on to inflation. Upstream price pressures are also building, which is evident in a rise in core producer price inflation from just 0.3% year on year two years ago to 2.4% now.

  • The US money market remains relatively complacent factoring less rate hikes than the Fed is signalling even though the Fed was right in 2017. This suggests the risk of a snap up in market Fed expectations at some point, particularly if inflation does start to rise as we expect.

  • The US is now further into monetary tightening so policy is no longer ultra easy. This is evident in a flattening in the US yield curve (although this may be heavily due to quantitative easing in Europe holding down Eurozone bond yields and this weighing in US bond yields). 

  • Finally, after a pause this year market positioning is no longer long the US and a more aggressive Fed could see the US dollar head higher in 2018 constraining US profits, commodity prices and reigniting concerns about a dollar funding crisis in the emerging world.

So while we are not particularly concerned about the Fed, there is a case to be a bit more cautious regarding it than was the case over the last two years.  

What does it mean for investors?

There are several implications for investors:

  • It’s too early for US monetary tightening to be a cyclical negative for shares, which will also likely benefit from US fiscal stimulus next year. However, the Fed is likely to become a source of volatility as next year progresses if US inflation starts to pick up as we expect. Other markets remain more attractive than US shares – notably Eurozone and Japanese shares that will benefit from cheaper valuations, easier monetary policy and lower currencies.

  • Continuing Fed rate hikes and US fiscal stimulus in 2017 will likely be a source of upwards pressure on global bond yields in 2018. So bonds are likely to continue to provide constrained returns. With the Reserve Bank of Australia (RBA) unlikely to follow the Fed though until maybe 2018, we continue to favour Australian over US bonds.

Impact on Australia

To the extent that the Fed’s further interest rate hike signals ongoing strength in the US, it’s good for Australia. It doesn’t signal that the RBA will soon follow and hike soon, though. Recent experience with the RBA hiking in 2009-10 (despite the Fed on hold at zero) and the RBA cutting in 2016 (when the Fed was hiking) highlights there is no automatic link. With the Australian economy remaining weaker relative to its potential than the US, risks around the Australian consumer, inflation running below target and Sydney and Melbourne house prices cooling, we remain of the view that the RBA will be on hold through much of next year and won’t raise rates till year end. 

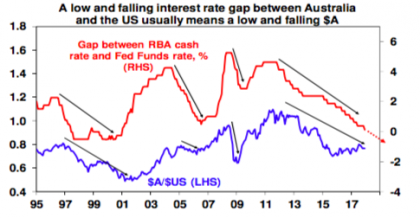
The main relevance of ongoing US monetary tightening is that it will serve to keep the $A down, notwithstanding the risks of a short term bounce higher in the $A. With the RBA on hold and the Fed set to continue raising rates, by March next year the Fed Funds rate will likely exceed the RBA’s cash rate with the interest rate differential set to further deteriorate against Australia through next year. If history is any guide, this is likely to see downwards pressure on the $A. We see the $A falling to around $US0.70 by end 2018 after its surprise strength in 2017.


Source: Bloomberg, AMP Capital

Important note: While every care has been taken in the preparation of this article, AMP Capital Investors Limited (ABN 59 001 777 591, AFSL 232497) and AMP Capital Funds Management Limited (ABN 15 159 557 721, AFSL 426455) makes no representations or warranties as to the accuracy or completeness of any statement in it including, without limitation, any forecasts. Past performance is not a reliable indicator of future performance. This article has been prepared for the purpose of providing general information, without taking account of any particular investor’s objectives, financial situation or needs. An investor should, before making any investment decisions, consider the appropriateness of the information in this article, and seek professional advice, having regard to the investor’s objectives, financial situation and needs. This article is solely for the use of the party to whom it is provided.

2017 – a relatively smooth year

 
By the standards of recent years, 2017 was relatively quiet. Sure there was the usual “worry list” – about Trump, elections in Europe, China as always, North Korea and the perennial property crash in Australia. And there was a mania in bitcoin. But overall it has been pretty positive for investors:
  • Global growth continued the acceleration we had seen through the second half of last year. In fact, global growth looks to have been around 3.6%, its best result in six years, with most major regions seeing good growth. Solid global growth helped drive strong growth in profits.

  • Benign inflation. While deflation fears faded further, underlying inflation stayed low and below target, surprising on the downside in the US, Europe, Japan and Australia. 

  • Rising commodity prices. Better than feared global demand and a surprise fall in the $US helped commodity prices along with constrained supply in the case of oil.

  • Politics turned out to be benign. Political risks featured heavily in 2017 but they turned out less threatening than feared: while political risk around Trump rose with the Mueller inquiry into his presidential campaign’s Russian links, business-friendly pragmatism dominated Trump’s first-year policy agenda and a trade war with China did not eventuate; Eurozone elections saw pro-Euro centrists dominate; North Korean risks increased but didn’t have a lasting impact on markets; Australian politics remained messy but arguably no more so than since 2010.

  • Another year of easy money. While the Fed continued to gradually raise interest rates and started reversing quantitative easing and China tapped the monetary brakes, central banks in Europe and Japan remained in stimulus mode and overall global monetary policy remained easy. 

  • Australia had okay growth hitting 26 years without a recession, but inflation remained below target. While housing construction started to slow and consumer spending was constrained, non-mining investment improved, infrastructure spending surged & export volumes were strong. Record low wages growth and low inflation kept the Reserve Bank of Australia (RBA) on hold, though.

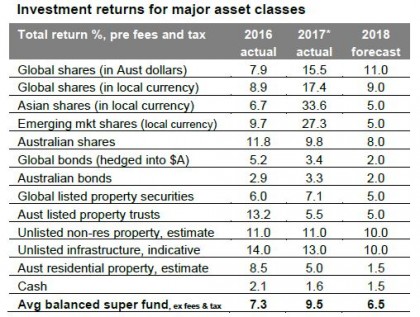
    The “sweet spot” of solid global growth and low inflation/benign central banks helped drive strong investment returns overall.


Yr to date to Nov. Source: Thomson Reuters, Morningstar, REIA, AMP Capital

  • Global shares pushed sharply higher supported by strong earnings, low interest rates and growing investor confidence. While Eurozone, Japanese and Australian shares saw 5-7% corrections along the way, US shares only saw brief 2-3% pullbacks. So volatility was very low.

  • The big surprise was that the US dollar fell rather than rose as low inflation kept expectations for Fed rate hikes depressed. This helped boost US shares but dragged on Eurozone shares as the Euro rose.  

  • Asian and emerging market shares were star performers thanks to leverage to global growth, rising commodity prices and a weaker $US, which reduced debt servicing costs.  

  • Australian shares had good returns but were relative laggards as has generally been the case this decade with weaker underlying profit growth. 

  • Bonds had mediocre returns. While inflation surprised on the downside, ultra-low yields constrained returns. 

  • Real estate investment trusts had a somewhat constrained year as investors remained a bit wary of listed yield plays.

  • Unlisted commercial property and infrastructure continued to do well as investors sought their still relatively high yields.

  • Australian residential property returns slowed as the heat came out of the Sydney and Melbourne property markets.    

  • Cash and bank term deposit returns were poor reflecting record low RBA interest rates. 

  • Reflecting US dollar softness, the $A actually rose helped by modest gains in commodity prices. 

  • Reflecting strong returns from shares and unlisted assets, balanced superannuation fund returns were strong.

2018 – looking ok but expect more volatility

2018 is likely to remain favourable for investors, but more constrained and volatile. The key global themes are likely to be: 
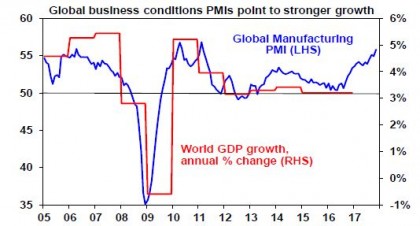
  • Global growth to remain strong. Global growth is likely to move up to 3.7%, ranging from around 2% in advanced countries to around 6.5% in China, with the US receiving a boost from tax cuts. Leading growth indicators such as business conditions PMIs point to continuing strong growth, but just bear in mind that they don’t get much better than this. Overall, this should mean continuing strong global profit growth albeit momentum is likely to peak.


Source: Bloomberg, IMF, AMP Capital

  • US inflation starting to lift. Global inflation is likely to remain low, but it’s likely to pick up in the US as spare capacity is declining, wages growth is picking up and as higher commodity prices feed through. We don’t expect a surge and the flow through in other major countries will be gradual. But higher US inflation may disrupt the yield trade at times and cause some nervousness.

  • Monetary policy divergence to continue. The Fed is likely to hike four times in 2018 (which is more than markets are allowing) and to continue with quantitative tightening but other central banks are likely to lag.• Political risk may have more impact after a relatively benign 2017. US political risk is likely to become more of a focus again (with the Mueller inquiry getting closer to Trump, the November mid-term elections likely to see the Republicans lose the House and the risk that Trump may resort to populist policies like protectionism to shore up his support), the Italian election is likely to see the anti-Euro Five Star Movement do well (albeit not well enough to form government), North Korean risks are unresolved and there is the risk of an early election in Australia. 

Fortunately, there is still no sign of the sort of excesses that drive recessions and deep bear markets in shares: there has been no major global bubble in real estate or business investment; there is the bitcoin mania but not enough people are exposed to that to make it economically significant globally; inflation is unlikely to rise so far that it causes a major problem; share markets are not unambiguously overvalued and global monetary conditions are easy. So arguably the “sweet spot” remains in place, but it may start to become a bit messier. p  

For Australia, while the boost to growth from housing will start to slow and consumer spending will be constrained, a declining drag from mining investment and strength in non-mining investment, public infrastructure investment and export volumes should see growth around 3%. However, as a result of uncertainties around consumer spending along with low wages growth and inflation, the RBA is unlikely to start raising interest rates until late 2018 at the earliest. 

Implications for investors

Continuing strong economic and earnings growth and still-low inflation should keep overall investment returns favourable but stirring US inflation, the drip feed of Fed rate hikes and a possible increase in political risk are likely to constrain returns and increase volatility after the relative calm of 2017:  

  • Global shares are due a decent correction and are likely to see more volatility, but they are likely to trend higher and we favour Europe (which remains very cheap) and Japan over the US, which is likely to be constrained by tighter monetary policy and a rising US dollar. Favour global banks and industrials over tech stocks that have had a huge run.

  • Emerging markets are likely to underperform if the $US rises as we expect.

  • Australian shares are likely to do okay but with returns constrained to around 8% with moderate earnings growth. Expect the ASX 200 to reach 6200 by end 2018. 

  • Commodity prices are likely to push higher in response to strong global growth. 

  • Low yields and capital losses from a gradual rise in bond yields are likely to see low returns from bonds.

  • Commercial property and infrastructure are likely to continue benefitting from the ongoing search for yield by investors. 

  • National capital city residential property price gains are expected to slow to around zero as the air comes out of the Sydney and Melbourne property boom and prices fall by around 5%, but Perth and Darwin bottom out, Adelaide and Brisbane see moderate gains and Hobart booms. 

  • Cash and bank deposits are likely to continue to provide poor returns, with term deposit rates running around 2.2%.

  • The $A is likely to fall to around $US0.70, but with little change against the Yen and the Euro, as the gap between the Fed Funds rate and the RBA’s cash rate goes negative.

What to watch?

The main things to keep an eye on in 2018 are: 
  • •The risks around Trump – the Mueller inquiry and the mid-term elections. We don’t see the Republicans impeaching Trump (unless there is evidence of clear illegality) but he could turn to more populist policies such as a trade war with China, a spat over the South China Sea or a clash with North Korea to boost his support.

  • How quickly US inflation turns up – a rapid upswing is not our base case but it would see a more aggressive Fed, more upwards pressure on the $US, which would be negative for US and emerging market shares and a rapid rise in bond yields.

  • The Italian election – the anti-Euro Five Star Movement is likely to do well and, even though it’s hard to see them being able to form government, this could cause nervousness; 

  • Whether China post the Party Congress embarks on a more reform-focussed agenda resulting in a sharp decline in economic growth – unlikely but it’s a risk.

  • Whether non-mining investment, infrastructure spending and export volumes are able to offset constrained consumer spending and a downturn in the housing cycle and how far Sydney and Melbourne property prices fall.


Source: AMP Capital 7 December 2017

Author: Dr Shane Oliver, Head of Investment Strategy and Economics and Chief Economist at AMP Capital is responsible for AMP Capital’s diversified investment funds. He also provides economic forecasts and analysis of key variables and issues affecting, or likely to affect, all asset markets.

Important note: While every care has been taken in the preparation of this article, AMP Capital Investors Limited (ABN 59 001 777 591, AFSL 232497) and AMP Capital Funds Management Limited (ABN 15 159 557 721, AFSL 426455) makes no representations or warranties as to the accuracy or completeness of any statement in it including, without limitation, any forecasts. Past performance is not a reliable indicator of future performance. This article has been prepared for the purpose of providing general information, without taking account of any particular investor’s objectives, financial situation or needs. An investor should, before making any investment decisions, consider the appropriateness of the information in this article, and seek professional advice, having regard to the investor’s objectives, financial situation and needs. This article is solely for the use of the party to whom it is provided.

By the time you are considering retirement, it is likely that you will have substantial equity in your home. You may even own your house outright. Selling the family home is one way to free up cash for retirement. The money you receive can be invested in shares, term deposits, managed funds or superannuation.

The impact on social security when you downsize

Your age pension entitlement depends on the value of your assets (the assets test) and the income you receive (the income test). Selling your home may have an impact on the amount of social security benefits you receive.

Your home and the 2 hectares surrounding it are not counted under the assets test. If you sell your home, the proceeds will be exempt for up to 12 months, as long as you are planning to use the money to buy another home. However, the proceeds will be deemed under the income test.

Case study: Lee Lin sells the family home

Lee Lin is 67 and divorced. She decides to sell the family home after her children move out because it is too big. She expected to sell her old home for $800,000, buy a cheaper apartment for $500,000 and have $300,000 left to invest.

Before she puts her house on the market, she goes to Centrelink and asked how the sale will affect her Age pension. The Financial Information Service officer tells her that the $300,000 will be counted towards the assets test for her Age pension. Lee decides she is still better off downsizing, even though it will reduce her pension.

Alternatives to downsizing your home

Selling the home where your children were raised and leaving behind neighbours and friends can be difficult and stressful. Add to that, the challenges of relocating to a new area, moving into a smaller space and making new friends. Suddenly, staying put might seem like a good idea.

Here are some alternatives to selling your home:

  • Think about converting your home to dual occupancy so you can live in one half and rent or sell the other half

  • Rent out some rooms (this has tax implications and may affect your age pension so seek financial advice before you proceed)

  • Consider a reverse mortgage if you need extra cash and have equity in your home

If you intend to stay in your house for the long term, you may want to renovate your home so that it’s safe and easier to move around as you get older. My aged care website has information on getting help to stay in your own home so you can maintain your independence for longer. 

What to do after you downsize

After you’ve sold your house, you may have money to invest in other income-producing assets. There are lots of options available so seek financial advice on the best mix of investment products for your needs.

Downsizing into super

In the May 2017 budget, the Government announced that from 1 July 2018, if you are aged 65 or over and sell your principal residence, that you have owned for at least 10 years, you will be able to make a non-concessional contribution to super of up to $300,000 from the proceeds. Couples will be able to contribute $300,000 each.

The contribution will not count towards the non-concessional contribution cap, the $1.6 million balance test, and you will not need to meet the existing maximum age or work test rules. See the ATO website for more information.

Selling the family home is not an easy or simple decision. Before you do anything, consult a financial adviser on the tax and social security implications, and speak to family and friends.

Please call us on Phone: 07 5641 4134 if you would like to discuss.

Source:
Reproduced with the permission of ASIC’s MoneySmart Team. This article was originally published at www.moneysmart.gov.au

Important note: This provides general information and hasn’t taken your circumstances into account.  It’s important to consider your particular circumstances before deciding what’s right for you. Although the information is from sources considered reliable, we do not guarantee that it is accurate or complete. You should not rely upon it and should seek qualified advice before making any investment decision. Except where liability under any statute cannot be excluded, we do not accept any liability (whether under contract, tort or otherwise) for any resulting loss or damage of the reader or any other person. Past performance is not a reliable guide to future returns.  

Important
Any information provided by the author detailed above is separate and external to our business and our Licensee. Neither our business, nor our Licensee take any responsibility for their action or any service they provide.

Any links have been provided with permission for information purposes only and will take you to external websites, which are not connected to our company in any way. Note: Our company does not endorse and is not responsible for the accuracy of the contents/information contained within the linked site(s) accessible from this page.

ASFA CEO Dr Martin Fahy and young Australians discuss super – why it’s the best bet for saving for retirement.

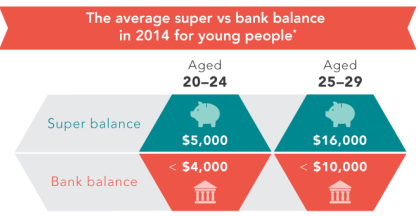
Research by ASFA has found that young Australians aged under 30 years tend to have more money in their superannuation accounts than their bank balances, yet 40 per cent of young people have no idea what their super balance is and a further 16 per cent only have a vague idea.

ASFA found around a quarter of Australians aged 15 to 19 had a superannuation account as did around 75 per cent of those aged 20 to 24. Average balances are not that large but are substantial relative to what most people had in their bank account.

* According to the latest available data from the Australian Bureau of Statistics

The research also revealed more than half of young people aged under 29 years strongly support superannuation as a good way to save for retirement, yet many significantly underestimate the amount of money they will need to retire.

Young people expect on average that they will need $625,000 while those aged 60 years and over staring down retirement expect on average that they will need nearly $1 million.

Young people who have multiple accounts and don’t consolidate those accounts risk eroding their super balances unnecessarily by paying multiple fees and charges.

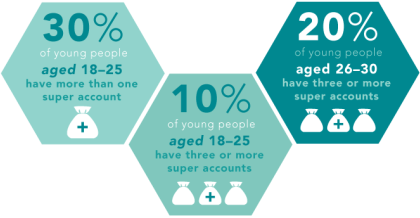
ASFA found more than 60 per cent of young Australians have multiple super accounts due to lethargy in consolidating them and 30 per cent report trouble in finding old accounts, despite ready online access available via MyGov.


Young people and super facts

  • Many young people will have a super balance. If you have a full time, part-time or even casual job and you earn more than $450 in a calendar month your employer is required to make super contributions to a fund on your behalf at the rate of 9.5 per cent of your wages. If you are aged less than 18, super contributions are only payable if you work more than 30 hours per week.

  • If you are employed, check your payslip and your superannuation account transaction records to make sure you are getting the contributions you are legally entitled to. If you are not, the first thing you can do is take it up with your employer. The Australian Taxation Office (ATO) can also help you with information and advice on your super entitlements and recovering any contributions your employer has not paid.

  • Multiple accounts can cost you dearly over time. Each account will typically have a fixed administration charge of at least $100 a year. The more accounts you have, the more administration fees you will pay. As well, with each account there could be associated insurance cover, with deduction of premiums of $200 or more per account.

  • While insurance coverage can be beneficial you should check to see you have the cover you want or need, particularly if you have more than one account. More than 25 per cent of people aged under 29 report they are not sure whether they have insurance cover, let alone knowing anything about its details.

  • Consolidating super accounts is not hard. All you have to do is log into your MyGov account and go to the ATO section to view the superannuation accounts you hold. Consolidating your super into just one account is only a few clicks away once you have mastered your MyGov login.

Source: 

Reproduced with the permission of the The Association of Superannuation Funds of Australia Limited. This article was originally published at http://www.superguru.com.au/grow-your-super/youngpeople

Important:

This provides general information and hasn’t taken your circumstances into account. It’s important to consider your particular circumstances before deciding what’s right for you. Although the information is from sources considered reliable, we do not
guarantee that it is accurate or complete. You should not rely upon it and should seek qualified advice before making any investment decision. Except where liability under any statute cannot be excluded, we do not accept any liability (whether under
contract, tort or otherwise) for any resulting loss or damage of the reader or any other person. Past performance is not a reliable guide to future returns.

Any information provided by The Association of Superannuation Funds Australia Limited detailed above is provided is separate and external to us and our Licensee. We nor our Licensee take any responsibility for their action or any service they provide.

Heard about mortgage refinancing? In the past, most people who took out a mortgage doggedly continued with it until they had paid it off. These days, people refinance their mortgage much more frequently. The average duration of a home loan in Australia now is just 4-5 years. Here we look at some of the reasons people in Australia refinance their home loan.

Mortgage refinancing reasons: lower rate

The most common reason for people to refinance their mortgage is to get a better deal. But be careful you don’t become interest rate-fixated. When you refinance your home loan, you need to consider fees and charges as well as the interest rate. You often have to pay charges for exiting your current home loan, plus charges for taking out the new mortgage. You need to be sure that in refinancing your home loan that you’ll be better off in the long run after taking into account all costs.

Mortgage refinancing reasons: more flexibility

Many people only discover the full details about their mortgage when it’s too late. They try to do something and get told by their lender that either they can’t do it, or they will incur a hefty charge if they do. An example is a redraw facility – the ability to pay extra money into a mortgage and then redraw it later. This feature is not possible with a basic home loan, so many people refinance their mortgage to give themselves this sort of increased flexibility.

Mortgage refinancing reasons: renovation

If you carry out renovations, it often makes sense to refinance your mortgage and take out a construction loan so you only pay interest as building progresses. Once construction is over, it might make sense to refinance your home loan again so that you consolidate the total amount you owe into a loan that minimises your interest bill, while giving you a degree of liquidity.

Mortgage refinancing reasons: home equity

Over recent years in the property market houses have appreciated at a significant rate. e.g. a home you bought for $300,000 five years ago, might now be worth $500,000. Refinancing your mortgage with a home equity loan might let you tap into that extra $200,000 equity.

Mortgage refinancing reasons: defaulting

Some people find they have borrowed more than they can comfortably repay, and they’re in danger of defaulting. There’s no shame in that. But don’t suffer in silence. If you’re having trouble making your mortgage repayments, talk to your MFAA member about refinancing your home loan to make it more manageable.

Talk to us on Phone: 07 5641 4134 about mortgage refinancing

Source:

Reproduced with the permission of the Mortgage and Finance Association of Australia (MFAA)

Important:

This provides general information and hasn’t taken your circumstances into account.  It’s important to consider your particular circumstances before deciding what’s right for you. Although the information is from sources considered reliable, we do not guarantee that it is accurate or complete. You should not rely upon it and should seek qualified advice before making any investment decision. Except where liability under any statute cannot be excluded, we do not accept any liability (whether under contract, tort or otherwise) for any resulting loss or damage of the reader or any other person.

Any information provided by MFAA detailed above is provided is separate and external to us and our Licensee. Neither we nor our Licensee take any responsibility for their action or any service they provide.

As with many things about investing, deciding when and whether to setup an SMSF should much depend on individual circumstances – that go well beyond age.

The tax office’s latest Self-managed super fund statistical report shows that 1.2 per cent of investors who established an SMSF in the March quarter of 2017 were aged under 25.

Interestingly, 11.5 per cent of members who established SMSFs in the latest March quarter were aged 25-34 while another 30.5 per cent were aged 35-44.

Indeed, the 35-44 is the peak age group, by far, for establishing a self-managed fund.

These statistics show that more than 43 per cent of investors who established SMSFs in the March quarter were under 44. This reflects how self-managed super sector is continually regenerating itself with new members.

A younger person who is thinking about setting-up an SMSF should first consider such factors as:

  • The size of existing super balances: Are my super savings large enough for an SMSF to be financially feasible or should I wait for a few more years until my super savings are higher? Unavoidable costs of running an SMSF can handicap the returns of low-balance members.

  • Knowledge: Do I have enough knowledge about sound investment practices and about the legal obligations of SMSF trustees to have my own fund? And am I willing to take specialist professional advice when needed? (Considerations here include trustee duties, investment risks, likely returns, liquidity, investment diversity, risks of inadequate diversity and investment selection.)

  • Time: Am I ready to set aside enough time necessary for running an SMSF? Many young people would prefer to be doing other things than dealing with a self-managed fund. It’s worth thinking about. That said, professional help is readily available with the investing and administration of SMSFs.

This is not to discourage young people from establishing their own funds; it’s to encourage them to consider it with their eyes wide open.

The fact that almost a third of SMSFs are established by members aged 35-44 seems to suggest that many investors are waiting until their balances build-up and their investment knowledge has grown before establishing a fund.

And, critically, it can take a few years to understand what you want to achieve from your superannuation.

It’s worth emphasising that things to think about before setting-up an SMSF go well beyond age.

For further information or assistance please contact us on Phone: 07 5641 4134.


Written by Robin Bowerman, Head of Market Strategy and Communications at Vanguard.

Source:

Reproduced with permission of Vanguard Investments Australia Ltd

Vanguard Investments Australia Ltd (ABN 72 072 881 086 / AFS Licence 227263) is the product issuer. We have not taken yours and your clients’ circumstances into account when preparing this material so it may not be applicable to the particular situation you are considering. You should consider your circumstances and our Product Disclosure Statement (PDS) or Prospectus before making any investment decision. You can access our PDS or Prospectus online or by calling us. This material was prepared in good faith and we accept no liability for any errors or omissions. Past performance is not an indication of future performance.

© 2017 Vanguard Investments Australia Ltd. All rights reserved.

Important:
Any information provided by the author detailed above is separate and external to our business and our Licensee. Neither our business, nor our Licensee take any responsibility for their action or any service they provide.

Any links have been provided with permission for information purposes only and will take you to external websites, which are not connected to our company in any way. Note: Our company does not endorse and is not responsible for the accuracy of the contents/information contained within the linked site(s) accessible from this page.