New Year resolutions and portfolio rebalancing face common challenges.

Both spring from the best of intentions. Both can drift into the background as the holiday season draws to a close and the urgency and demands of everyday life return.

For self-managed super funds (SMSFs), the more relaxed pace of life earlier in the year often presents the opportunity to review the fund’s portfolio and investment strategy.

Setting a fund’s asset allocation is arguably the most important decision SMSF trustees make.

At a time when there is heightened levels of uncertainty on the geopolitical stage, the value of rebalancing the portfolio periodically to keep the portfolio within the risk ranges you are comfortable possibly takes on even more importance.

As 2017 gets into full swing it is worth reflecting on the year just gone. For SMSF trustees, a challenge can be knowing how your fund is performing and a critical data point is knowing what to benchmark your fund against.

Broad-based market index funds provide an easy and accessible way to measure your fund’s performance while mainstream super funds are another point of reference.

In 2016, defensive assets like fixed interest did their job of providing stability to portfolios, with the Australian fixed interest index delivering 2.7 per cent and Australian government bonds 2.5 per cent.

Australian shares enjoyed another year of double digit returns with the Australian shares index fund delivering 11.5 per cent and the high-yield index fund slightly lower at 10.6 per cent.

International shares delivered 8.03 per cent on an unhedged basis while if the currency impact was hedged out the return was higher at 10.4 per cent.

Emerging markets and international small companies delivered 11.03 per cent and 13.02 per cent respectively on an unhedged basis. Global infrastructure index – a specialist asset class that can be hard for SMSFs to access directly – ended 2016 up 12.66 per cent.

On the property front, Australian listed property returned 13 per cent while international listed property was 6.69 per cent with currency hedging.

When reviewing individual asset classes, the danger and/or temptation is to focus on the top-performing sector. At this point, it is good to remember that past performance is never guaranteed to be repeated next year.

Potentially a more meaningful benchmark for an SMSF to look at is the performance of diversified funds that invest in a spread of asset classes based on target risk levels.

In 2016, the conservative Vanguard index fund returned 6.06 per cent, the balanced fund 7.35 per cent, the growth fund 8.5 per cent and high growth 9.67 per cent.

The key comparison point here with an SMSF is understanding the portfolio split between defensive and growth assets. For example, the balanced fund is 50/50 while the growth fund is 70/30 growth assets to defensive assets.

The rebalancing question comes into play after one asset class has had a significant growth (or loss).

A typical SMSF has strong allocation to Australian shares – according to Investment Trends research around 40 per cent of an average SMSF portfolio is in local shares. Given 2016 returns of 11.5 per cent for the Australian sharemarket, portfolios are likely to have moved out of target asset allocation ranges.

This is why the discipline of regular reviews of the SMSF portfolio’s asset allocation is so valuable.

If you find your SMSF portfolio has moved outside the tolerance levels you or your adviser has set then the next question is how do you go about rebalancing to get it back to the point you are comfortable with the allocation.

The simplest way is to use new cashflows/contributions to buy more of the asset class that is now underweight.

Where it is more complex is if you do not have cashflows to work with and so you will need to consider selling some assets to provide the cash for the rebalance. This can involve both transaction costs and have potential tax implications, so it can be good to seek expert advice either from a financial adviser or an accountant specialising in SMSF work.

The concept of rebalancing is one of those things that is simple to say but harder to carry through on. One of the emotional hurdles many investors struggle with when it comes time to rebalance is the reality that you are buying into the weakest performing asset class, and potentially selling your strongest performing asset.

That can cause investors to procrastinate and which is when rebalancing ends up in the company of other well-intentioned New Year resolutions.

If you would like to discuss, please call us on Phone: 07 5641 4134 or email martin@wtfp.com.au.


Source:

Written by Robin Bowerman, Head of Market Strategy and Communications at Vanguard.

Reproduced with permission of Vanguard Investments Australia Ltd

Vanguard Investments Australia Ltd (ABN 72 072 881 086 / AFS Licence 227263) is the product issuer. We have not taken yours and your clients’ circumstances into account when preparing this material so it may not be applicable to the particular situation you are considering. You should consider your circumstances and our Product Disclosure Statement (PDS) or Prospectus before making any investment decision. You can access our PDS or Prospectus online or by calling us. This material was prepared in good faith and we accept no liability for any errors or omissions. Past performance is not an indication of future performance.

© 2017 Vanguard Investments Australia Ltd. All rights reserved. 

Important:

Any information provided by the author detailed above is separate and external to our business and our Licensee. Neither our business, nor our Licensee take any responsibility for their action or any service they provide.
“It’s not what you own that gets you into trouble, but what you owe.”

Excessive debt tends to be at the centre of most scare stories regarding the investment outlook – whether they relate to China, public debt in developed countries, corporate debt in the US or Australian household debt. The standard debt related scare story runs something along the lines of “we have lived beyond our means. Any attempt to prevent a debt implosion won’t work or will just delay the inevitable. Divine retribution will get us in the end!” One big debt scare that gets wheeled out is that total global debt outstanding has reached a new record high of nearly $US200 trillion and either that on its own or in combination with any significant rise in global interest rates will trigger the next crisis. To be sure problems with debt or a desire to reduce it are part and parcel of most financial crises and economic downturns. And total global debt has indeed reached record levels. But that’s not the same as saying another financial crisis is imminent. This note looks at the main issues.

Global debt – first some facts

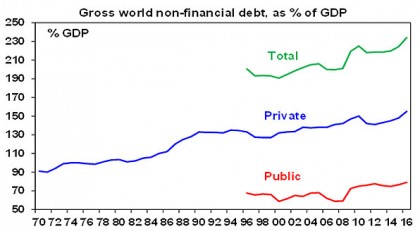
Excluding the debt of financial companies like banks (to avoid double counting) total gross world public and private debt is around $US170 trillion. That is a record high big scary number but it’s meaningless unless it’s compared to something. An obvious comparison is to income levels and the best guide to that at an economy wide level is GDP. Again new records have been reached with gross world public and private non-financial debt rising to a record of 235% of global GDP.

Since the global financial crisis (GFC) the climb in overall debt has been due to rising public debt in the developed world (DM) and rising private debt in the emerging world (EM). The rise in developed world public debt reflects GFC related stimulus programs and the failure to turn budget deficits into budget surpluses post the GFC.

The $US200 trillion global debt mountain
Source: IMF, Haver Analytics, BIS, Ned Davis Research, AMP Capital

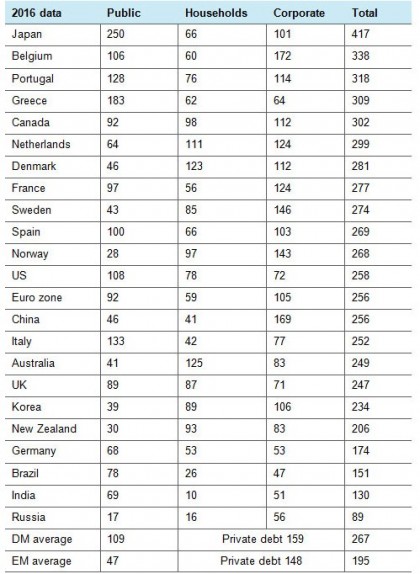
The next table compares total debt for various countries.

Total gross non-financial debt outstanding, % GDP

Total gross non-financial debt outstanding, % GDP
Source: IMF, Haver Analytics, BIS, Ned Davis Research, AMP Capital

There are some qualifications to the table. For example, because of public investments in debt via sovereign wealth funds, central bank reserves, etc, net public debt is usually well below gross debt. In Norway net public debt is -274% of GDP and in Japan its 128% of GDP. So gross debt data exaggerates the total level of debt. But as an overview:

  • Japan, Belgium, Portugal and Greece have relatively high total debt levels;

  • Germany, Brazil, India and Russia have relatively low debt;

  • Australia does not rank highly in total debt – it has very high household debt but its offset by low public & corporate debt;

  • Emerging countries tend to have relatively lower debt, but China is an exception given a high level of corporate debt.

But the bottom line is that global debt is at record levels even adjusted for GDP. As a result some fear that any rise in interest rates will immediately derail global growth. Excessive debt can also be associated with slower growth and a higher risk of a financial crisis. Of course it’s not that simple.

Debt, savings and income dynamics

Firstly, the relationship between income, savings and debt is more complicated that often portrayed. The Global Investment Strategy service of Bank Credit Analyst Research (a Canadian research house) recently illustrated this using some simple examples. Suppose there is an island with 100 people, each producing 100 coconuts a year. Here are three possibilities.

Case 1: Output is 10,000 coconuts with each person consuming 100. Saving and investment are zero and no debt is created.

Case 2: Each person consumes only 75 coconuts a year, selling the remainder to a plantation who buys them with a bank loan and plants them resulting in 2500 new coconut trees. Consumption is 7500 coconuts. Savings and investment are 2500 and debt has gone up by 2500 coconuts.

Case 3: Each person consumes 125 coconuts, by importing 25 each. Consumption is now 12,500 coconuts, savings is -2500 coconuts, investment is zero and the current account deficit is 2500. External debt goes up by 2500. This is arguably more risky if foreign islands decide they want their coconuts back!

The point is that debt can rise in an economy even if it lives within its means and invests for the future as Case 2 illustrates. No need for divine retribution here!

Reasons not to be too alarmed about record debt

There are several reasons not to be too alarmed by the rise to record debt levels.

First, the level of debt has been rising ever since debt was invented. This partly reflects greater ease of access to debt over time. But it also reflects the fact that the level of debt is a stock while income is a flow. Suppose an economy starts with $100 of debt and $100 in assets and in year 1 produces $100 of income and in each year it grows by 5%, consumes 80% of its income and saves 20% which is recycled as debt. At the end of year 1 its debt to income ratio will be 120%, but by the end of year 5 it will be 173%. But assuming its assets rise in line with debt its debt to asset ratio will remain flat at 100%. So the very act of saving and investing creates debt and rising debt to income ratios.

Second, China has led the surge higher in private debt in recent years but is an example of Case 2 where it borrows from itself. The main problem in China is that it has a very high savings ratio of nearly 50% of GDP and this saving is largely recycled through the banking system (partly because of a less developed share market) and this results in strong debt growth. But not much of this has gone into the Chinese property market (household debt is low) – rather it finds its way into corporate debt and investment. But this is largely matched by an expansion in productive assets and is really a reflection of fiscal policy and is subject to government support if there’s a problem.

Third, the rise in private debt in the emerging world is not that concerning as they, like younger workers, have a higher growth potential going forward than developed countries. Of course the main problem emerging countries face is that they borrow too much in US dollars and either a sharp rise in the $US or a loss of confidence by foreign investors causes a problem. But there are no signs of the latter and emerging countries seem to have weathered the rise in the $US since 2014 pretty well.

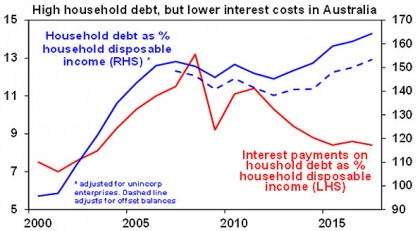
Fourth, debt interest burdens are low and in many cases still falling as more expensive long maturity older debt rolls off. For example despite the recent rise in bond yields US public debt interest payments are less than 3% of US GDP – well down from 4.5% in 1991. And given the long maturity of much debt in advanced countries it will take time for higher bond yields to feed through into actual interest payments. In Australia, interest payments as a share of household disposable income are at their lowest since 2003, and are down by more than a third from their 2008 high. See the next chart. Moreover there is no sign of significant debt servicing problems globally or in Australia – unlike in relation to US sub-prime debt just prior to the GFC.

High Household debt
Source: RBA, AMP Capital

Fifth, most of the debt increase in recent years in developed countries has come from public debt and governments can tax and print if worse comes to worse. Japan is perhaps most at risk here given its very high level of public debt but it has borrowed from itself (Case 2 again) and Japan remains one of the world’s biggest creditor nations. And even if Japanese interest rates do rise sharply (which is unlikely with the BoJ maintaining zero 10 year bond yields) 40% of Japanese Government bonds are held by the BoJ so higher interest payments to it will simply be paid back to the Government.

Sixth, when it comes time to raise interest rates central banks will adopt a gradual approach knowing that in an environment of higher debt they don’t need to raise rates as much to have an impact on inflation or growth as had been the case in the past. The gradual approach is currently evident at the Fed.

Finally, increased debt of itself is rarely the source of a shock to economies. Some sort of trigger is required – usually much higher interest rates or rising defaults as economies sour or after a big deterioration in lending standards – as was evident in the US sub-prime crisis. At present these seem unlikely.

Concluding comment and investment implications

None of this is to say there’s nothing to worry about. History tells us that the next major crisis will involve debt problems of some sort. But just because global debt is at record levels and that global bond yields have moved higher does not mean a crisis is imminent. For investors, debt levels are something to keep an eye on – particularly if there is a broad based surge in debt in the context of surging asset prices. At present, apart from pockets of concern (eg, Sydney & Melbourne property markets) there is no sign of this on a generalised basis globally.


Source: AMP Capital 22 March 2017

Author

Dr Shane Oliver, Head of Investment Strategy and Economics and Chief Economist at AMP Capital is responsible for AMP Capital’s diversified investment funds. He also provides economic forecasts and analysis of key variables and issues affecting, or likely to affect, all asset markets.

Important note: While every care has been taken in the preparation of this article, AMP Capital Investors Limited (ABN 59 001 777 591, AFSL 232497) and AMP Capital Funds Management Limited (ABN 15 159 557 721, AFSL 426455) makes no representations or warranties as to the accuracy or completeness of any statement in it including, without limitation, any forecasts. Past performance is not a reliable indicator of future performance. This article has been prepared for the purpose of providing general information, without taking account of any particular investor’s objectives, financial situation or needs. An investor should, before making any investment decisions, consider the appropriateness of the information in this article, and seek professional advice, having regard to the investor’s objectives, financial situation and needs. This article is solely for the use of the party to whom it is provided.

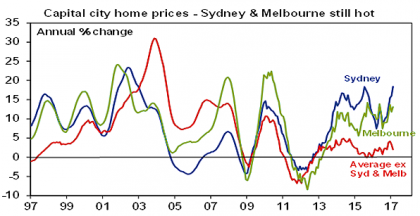
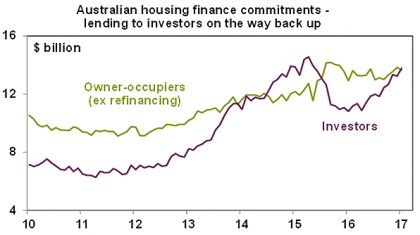
The cooling in the Sydney and Melbourne property markets evident in late 2015 in response to macro prudential tightening deployed by APRA has proved ephemeral. Price gains have reaccelerated and auction clearance rates & lending to property investors have rebounded. Over the last five years Sydney dwelling prices have risen a ridiculous 73% and Melbourne prices are up 47%. As a result the Australian housing market continues to cause much angst around poor affordability and high household debt. This note looks at the main issues.

1 The Australian housing market - what are the key issues
Source: CoreLogic, AMP Capital

Is Australian housing overvalued?

On most measures Australian housing is overvalued:

  • On the basis of the ratio of house prices to rents adjusted for inflation relative to its long term average Australian houses are 39% overvalued and units 13% overvalued.

  • According to the 2017 Demographia Housing Affordability Survey the median multiple of house prices in cities over 1 million people to household income is 6.6 times in Australia versus 3.9 in the US and 4.5 in the UK. In Sydney it’s 12.2 times and Melbourne is 9.5 times.

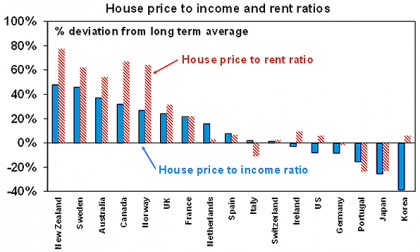
  • The ratios of house prices to incomes and rents are at the high end of OECD countries.

2 The Australian housing market - what are the key issues
Source: OECD, AMP Capital

Why is it so expensive and household debt so high?

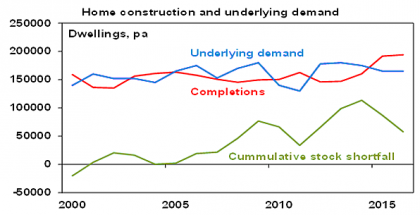
There are two main drivers of the surge in Australian home prices over the last two decades. First, the shift from high to low interest rates has boosted borrowing and hence buying power. This has taken Australia’s household debt to income ratio from the low end of OECD countries 25 years ago to the top end. Second, there has been an inadequate supply response to demand. The following chart shows a cumulative shortfall relative to underlying demand had built up by 2014 and is still yet to be worked off despite record construction lately.

3 The Australian housing market - what are the key issues
Source: ABS, AMP Capital

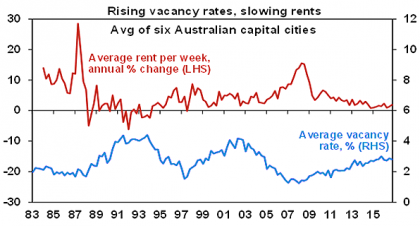
Consistent with this, while vacancy rates have increased they have only increased to around average long term levels. In Sydney vacancy rates are below average.

What about investors and foreign buyers?

A range of additional factors may be playing a role in accentuating demand beyond that implied by population growth. These include negative gearing and the capital gains tax discount, foreign buying and SMSF buying. Negative gearing is just part of the normal operation of the Australian tax system. However, the interaction with the capital gains tax discount by enhancing the after tax return available to property investment may be resulting in higher investment activity than would otherwise be the case. This may particularly be the case when past property price gains have been strong encouraging investors to think future gains will be too. While commitments to lend to property investors slowed in 2015 after APRA tightened macro prudential controls, this has since worn off.

4 The Australian housing market - what are the key issues
Source: ABS, AMP Capital

Foreign buying is likely also impacting – with indications that it is around 10-15% of demand – but it is also concentrated in particular areas and SMSF buying appears to be relatively small. But like lower interest rates, all of these should have a less lasting impact if the supply response was stronger.

Is a crash likely?

The surge in prices and debt has led many to conclude a crash is imminent. But we have heard that lots of times over the last 10-15 years. In 2004, The Economist magazine described Australia as “America’s ugly sister” thanks in part to a “borrowing binge” and soaring property prices. Most recently the OECD has warned of the risks of a property crash. However, the situation is not so simple:

  • Firstly, we have not seen a generalised oversupply and at the current rate we won’t go into oversupply until 2018 and in any case approvals suggest supply will peak this year.

  • Secondly, mortgage stress is relatively low and debt interest payments relative to income are around 2003-04 levels.

  • Thirdly, lending standards have not deteriorated like they did in other countries prior to the GFC. In recent years there has been a reduction in loans with high loan to valuation ratios and interest only loans are down from their peak.

  • Finally, generalising is dangerous. While prices have surged in Sydney and Melbourne, they have fallen in Perth to 2007 levels and seen only moderate growth in other capitals.

To see a general property crash – say a 20% plus average price fall – we need to see one or more of the following: a recession – which looks unlikely; a surge in interest rates – but rate hikes are unlikely until 2018 and the RBA will take account of the greater sensitivity of households to higher rates; and property oversupply – this would require the current construction boom to continue for several years. However, the risks on the supply front are high in relation to apartments.

What can be done to fix it?

Recent RBA commentary strongly hints that more macro prudential measures to tighten lending standards are on the way. These could include a further lowering in the 10% growth cap on the stock of lending to investors and tougher debt serviceability tests. This is in part about reducing the risks to financial stability when it’s too early to consider raising rates.

More fundamentally, policies to help address poor housing affordability should focus on boosting new supply, particularly of standalone homes which have lagged. This includes relaxing land use restrictions, releasing land faster, speeding up approval processes and encouraging greater decentralisation. This is largely a state issue. Policies designed to make better use of the existing housing stock (eg, by relaxing constraints on empty nesters downsizing) could also help.

Policies that are unlikely to be successful include increased first home owner grants (as in periods of high demand they just result in higher prices) and allowing first home buyers to access to their super (again this will just result in even higher prices unless supply is fixed before and will mean less in retirement).

Tax reform should ideally be part of the package and include replacing stamp duty with land tax (again a state issue), removing the capital gains tax discount that is a distortion in the tax system and lower income tax rates to discourage use of negative gearing as a tax avoidance strategy. Piecemeal cuts to stamp duty targeted at FHBs will just result in higher home prices. Abolishing negative gearing would just inject another distortion in the tax system and could adversely affect supply (although I can see a case to cap excessive benefits).

What is the outlook?

Generalised price falls are unlikely until the RBA starts to raise interest rates again and this is unlikely until later in 2018, which after a few hikes will likely trigger a 5-10% pullback in property prices as was seen in the 2009 & 2011 cycles:

  • Sydney & Melbourne having seen big gains are most at risk.

  • Prices are likely to fall further in Perth and Darwin this year, but they are close to bottoming and should rise next year.

  • The other capitals are likely to see continued moderate growth this year and a less severe down cycle around 2019.

  • But units are at much greater risk given surging supply and this could see unit prices in parts of Sydney & Melbourne fall by 15-20% as investor interest fades as rents falls.

What are the risks to the economy?

Slowing momentum in building approvals points to a slowdown in the dwelling construction cycle ahead. This combined with a slowing wealth affect from rising home prices means that the contribution to growth from the housing will slow. However, as this is likely to coincide with a fading in the detraction from growth due to falling mining investment and higher commodity prices it’s unlikely to drive a slowing in the economy. However, a likely decline in rents (as the supply of units hits) will constraint inflation helping keep interest rates low for longer.

5 The Australian housing market - what are the key issues
Source: REIA, AMP Capital

A property crash would have bigger impact given the exposure of banks, but as noted above such a development is unlikely.

Implications for investors

  • While there is a strong long term role for residential property in investors’ portfolios at present their remains a case for caution. It is expensive on all metrics and offers very low net income (rental) yields of 2% or less. This leaves investors highly dependent on capital growth.

  • But it is dangerous to generalise. Apartments in parts of Sydney and Melbourne are probably least attractive. Best to focus on areas that have lagged behind.

  • Finally, investors need to allow for the fact that they likely already have a high exposure to Australian housing. As a share of household wealth it’s nearly 60%.

Source: AMP Capital 15 March 2017

About the Author

Dr Shane Oliver, Head of Investment Strategy and Economics and Chief Economist at AMP Capital is responsible for AMP Capital’s diversified investment funds. He also provides economic forecasts and analysis of key variables and issues affecting, or likely to affect, all asset markets.

Important note: While every care has been taken in the preparation of this article, AMP Capital Investors Limited (ABN 59 001 777 591, AFSL 232497) and AMP Capital Funds Management Limited (ABN 15 159 557 721, AFSL 426455) makes no representations or warranties as to the accuracy or completeness of any statement in it including, without limitation, any forecasts. Past performance is not a reliable indicator of future performance. This article has been prepared for the purpose of providing general information, without taking account of any particular investor’s objectives, financial situation or needs. An investor should, before making any investment decisions, consider the appropriateness of the information in this article, and seek professional advice, having regard to the investor’s objectives, financial situation and needs. This article is solely for the use of the party to whom it is provided.

The long running soap opera around whether the Eurozone will break up is now into its eighth year! In 2015 all the focus was on the latest Greek tantrum and last year the big fear was that the populist/nationalist Brexit vote and Trump victory would lead to a surge in support for populist parties across Europe and drive a Eurozone break up. There was no sign of this in Spanish and Austrian elections, but this will be put to the test again with elections this year in the Netherlands, France, Germany and maybe in Italy. The fear is that a Eurozone break up will plunge the world’s third biggest economic region into recession and financial chaos, which would adversely affect the global economy and Australia. Such a fear may be exaggerated – the UK hardly imploded after Brexit – but that’s the worry.

The big picture

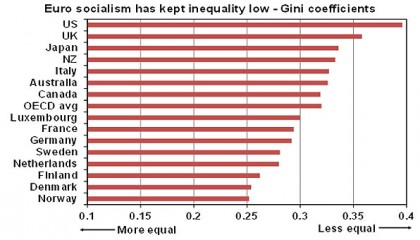
There are several reasons why Europe differs to the UK and US. Firstly, it doesn’t have the issues with inequality that drove the anti-establishment backlash in the US and UK. The Gini coefficient which measures income inequality is below average.

 The Gini coefficient
After taxes and transfers. Source: OECD, AMP Capital

Secondly, Eurozone break up risk may have peaked with the high point of the Eurozone debt crisis – when unemployment & fiscal austerity were at their peak in 2013. But unemployment has now fallen and fiscal austerity has ended. An abatement of the migration crisis may help too with sea arrivals slowing from over 200,000 a month in October 2015 to around 5000 recently.

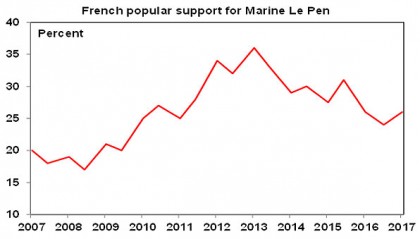
Thirdly, despite the media frenzy the Eurozone populist parties are not really doing any better than a few years ago (mostly anyway). See below in relation to Marine Le Pen in France.

Further, leaving the Euro is not as simple as leaving the European Union as it would entail currency redenomination, the anticipation of which would drive a likely exit of foreign investors fearful of getting paid back in depreciated currency.

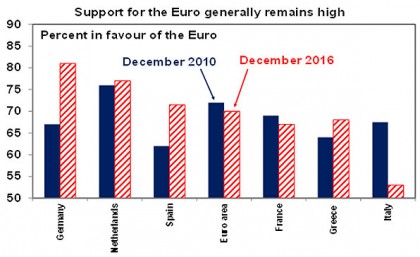
Finally, support for the Euro remains high in the Eurozone at around 70%. So to attain power the populists invariably have to renounce their anti-Euro policies as Syriza did in Greece.

Support for Euro generally
Source: Eurobarometer, AMP Capital

But a chain is only as strong as its weakest link and there are risks at the individual country level, to which we now turn.

The Netherlands (parliamentary election March 15)

There are 28 parties contesting the parliamentary elections and 14 could enter parliament. Gert Wilders’ populist Eurosceptic Freedom Party may get a greater share of the vote and more seats than any other party but support has slipped from around 20% of the vote and seats to around 17% in recent polls. It won’t be able to form government, which will ultimately come from a group of centrist parties (which have rejected working with Wilders). Support for the Euro is very high at around 77%.

France (presidential elections on April 23 and May 7 and parliamentary elections on June 11 and 18)

The presidential election is a two round contest with the two highest placed candidates in the first round on April 23 then facing a run-off on May 7. Polling indicates that Marine Le Pen of the National Front (whose policy is to reinstate the Franc for domestic purposes, redenominate public debt into the Franc, allow the Bank of France to finance budget deficits and undertake a big round of public spending) is likely to “win” the first round (in the sense of getting more votes than anyone else with polls running around 26% support compared to around 24% for her nearest rival, Emmanuel Macron). And her chances of winning the second round have been boosted by allegations the Republican Party’s candidate Francois Fillon used public money to pay his family when he was a parliamentarian for fake work and rioting in the Paris suburb of Aulnay-sous-Bois.

However, several considerations work against a Le Pen victory in the second round. Firstly, support for Le Pen actually peaked several years ago and has since fallen back to around 26%. This suggests that the real issue is not the rise of Le Pen, but weakness in the conventional parties, ie the Socialists thanks to President Hollande and the Republican’s problems with Fillon. Le Pen also has similar allegations against her to those against Fillon, although so far this isn’t having much impact.

French popular support for Le Pen
Source: IPSOS, AMP Capital

Secondly, French support for the Euro is relatively strong at 67%, whereas Le Pen advocates an exit from the Euro.

Thirdly, while Fillon is in trouble, former economy minister now running as an independent, Emmanuel Macron has been seeing increased poll support and on some recent polls has been running just ahead of Le Pen for the first round. What counts though is the final round. Polling currently shows that if the second round is between Macron and Le Pen – which looks most likely – then Macron will win by around 20 to 25%. If it’s between Fillon and Le Pen then Fillon is ahead by around 14%. And these margins are much wider than was the case in relation to opinion polls at the same point ahead of the US election when it was around 3% in favour of Clinton.

The bottom line is that current polling indicates Le Pen will not win the second round. However, France is not without risk. For example, more race related rioting in French suburbs or a major terrorist attack would play into the hands of Le Pen. The leaking of Russian hacks into Macron’s campaign may also do the same – as Russia stands to benefit from a Le Pen win.

However, even in the event of a Le Pen victory, it’s doubtful she would be able to implement her policies in relation to the Euro because her National Front is very unlikely to win a majority in the June parliamentary elections and leaving the Euro would require an act of parliament. In any case a panic in the French bond market upon a Le Pen victory (as investors fear getting paid back in devalued Francs) would likely force Le Pen to back down much as occurred with Syriza in Greece.

Finally, note that Macron (and Fillon) is pro Euro and economic reform oriented, which is just what France needs. So a Macron victory by either would be positive for France.

Germany (election September 24)

German Chancellor Angela Merkel is at some risk of losing to the centre-left Social Democrat Party whose new leader Martin Schulz is polling well. But while there may be a bit of market angst if Merkel is defeated, this would soon be forgotten as Schulz is more pro Europe than Merkel so even if he does win it could actually mean a stronger Eurozone as he and the SPD are likely to undertake German fiscal reflation (which could help countries like Italy). The populist Alternative for Deutschland is stuck at around 10% support, reflecting Germans’ 80% support for the Euro. So Germany is not really an issue.

Italy (possible election around September)

Perhaps the country at greatest risk is Italy. The next election is not due to 2018, but Matteo Renzi who is still the leader of the governing Democratic Party (PD) is keen on having it earlier – possibly September – given the ongoing softness of the Italian economy. However, there is a high risk that the Eurosceptic Five State Movement (5SM) will win. Eurosceptic parties are polling in line with establishment parties in Italy, support for the Euro in Italy has fallen to around 53% and a possible split in the governing PD party will add to support for Eurosceptic parties. However, even if the 5SM “wins” in the next election and successfully forms a coalition government (it’s unlikely to win a majority in parliament) a move towards an exit from the Euro (Itexit) would likely drive a market panic leading to sharply higher Italian bond yields which in turn would adversely affect the Italian economy and most likely cause 5SM to backdown.

Greece

Greece remains a risk given the state of its economy and tough negotiations with its creditors. But there is no longer a populist Eurosceptic party for the Greeks to turn too. In fact if there were an early election the pro-Euro New Democracy party would win.

Spain – Catalonia

Finally, the Catalonia region of Spain looks likely to have another independence referendum around September. But for most Catalonians this seems to be more about more autonomy from Spain than actually wanting independence. Turnout is likely to be low again and without recognition from Spain (or EU support) it’s unlikely to go anywhere even if “yes” wins again.

Risks

Our base case is that the Eurozone stays together, but there are two main risks around this. Firstly, if the migration crisis ramps up again or terrorist attacks escalate which could drive broader based support for populists. Secondly, weak centrist coalition governments risk turning the populist Eurosceptics into the main opposition and leave their countries vulnerable to a populist take over the next time there is a significant economic downturn. Alternatively, if the European economy continues to recover – and gripes around immigration and EU bureaucracy are dealt with – support for the populists may decline over time.

Key implications for investors

There are several implications for investors. Firstly, various elections will no doubt keep Eurozone break-up fears alive causing periodic short term investment market volatility.

Second, while the Eurozone economy looks stronger political risk maintains pressure on the European Central Bank to keep its quantitative easing program going out to year end, delay announcing any “tapering” in it and remain dovish. This will maintain downwards pressure on the Euro.

Finally, if we are right and the Eurozone continues to hang together then bouts of financial turmoil triggered by break-up fears are buying opportunities – just as we have seen since the Eurozone debt crisis began in 2010.

Source: AMP Capital 8 March 2017

About the Author

Dr Shane Oliver, Head of Investment Strategy and Economics and Chief Economist at AMP Capital is responsible for AMP Capital’s diversified investment funds. He also provides economic forecasts and analysis of key variables and issues affecting, or likely to affect, all asset markets.

Important note: While every care has been taken in the preparation of this article, AMP Capital Investors Limited (ABN 59 001 777 591, AFSL 232497) and AMP Capital Funds Management Limited (ABN 15 159 557 721, AFSL 426455) makes no representations or warranties as to the accuracy or completeness of any statement in it including, without limitation, any forecasts. Past performance is not a reliable indicator of future performance. This article has been prepared for the purpose of providing general information, without taking account of any particular investor’s objectives, financial situation or needs. An investor should, before making any investment decisions, consider the appropriateness of the information in this article, and seek professional advice, having regard to the investor’s objectives, financial situation and needs. This article is solely for the use of the party to whom it is provided.

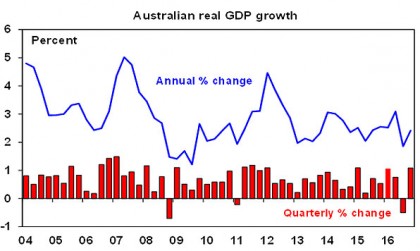
For the last few years we have heard constant predictions of a recession in Australia as the mining boom turned to bust and a housing bust was seen to follow. Some even went so far as to say that an imminent recession was “unavoidable”. Those fears intensified after the September quarter GDP data showed the economy going backwards. But a 1.1% rebound in December quarter growth highlights that yet again it hasn’t happened. The December quarter rebound was on the back of stronger consumer spending, housing investment, business investment, public demand and export volumes. So where to from here?

Australian real GDP growth
Source: ABS, AMP Capital

The Australian worry list

To be sure, aside from global threats, Australia has its own worry list. The key threats and constraints are as follows:

  • Business investment plans point to mining investment continuing to fall at the rate of 30% or so a year.

  • Housing construction activity is likely to peak this year, a large supply of apartments will hit various cities, affordability is poor and household debt levels are very high.

  • The Australian dollar arguably remains too high and has risen more than 10% from early last year. (That said most countries want a lower currency these days.)

  • Unemployment and underemployment at a combined 14% are high. The combination in the US is 9.4%.

  • Inflation is too low and risks staying below the 2-3% target for longer reflecting record low wages growth, a rising $A, competitive pressures and weak rents as new supply hits.

  • Our political leaders seem collectively incapable of undertaking productivity enhancing economic reforms

That said, most of these concerns are not new and have been discussed endlessly. Endless whinging about them is distracting from the good news.

Reasons to be upbeat on the outlook for Australia

In fact, there remains good reason to be upbeat on Australia.

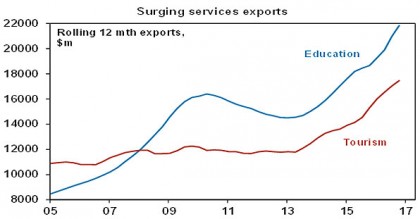
  • Firstly, at now 102 quarters without a recession, Australia is on track to take out the Netherland’s record of 103 quarters without a recession. This owes a bit to statistical luck, but it also reflects the benefits of the economic reforms of the 1980s and 1990s that made the economy more flexible and sensible macro-economic management that meant that when the mining boom ended it enabled other sectors of the economy to take over in driving growth. This included housing and services exports like tourism and higher education.

Surging services exports
Source: ABS, AMP Capital

  • Secondly, reflecting this, the south eastern states of NSW, Victoria and ACT are continuing to perform strongly in reversal of the so-called two speed economy.

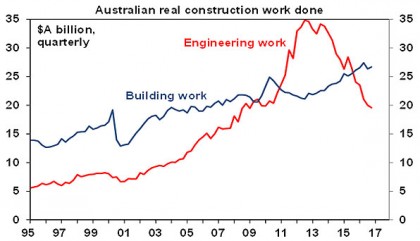
  • Thirdly, while mining investment is continuing to decline, it’s now a smaller share of the economy so its decline is having a diminishing impact and it’s nearing the bottom anyway. At its peak in 2012 it was 7% of GDP whereas its now less than half that so a 30% annual decline is having half the impact on the economy. What’s more mining investment intentions indicate that by mid next year it will have fallen back to around its long term norm of about 1.5% of GDP. Engineering construction – which has been dominated by mining activity – has already fallen back to its long term trend. This means a slowing in housing investment is less of a threat because it will be offset by a lessening in the detraction by falling mining investment.

Australian real construction work done
Source: ABS, AMP Capital

  • Fourthly, we are continuing to benefit from the third phase of last decade’s mining boom, which is the surge in resource export volumes as new projects complete – notably gas projects this year.

  • Fifthly, the blow to national income from the slump in commodity prices has reversed as prices for iron ore, metals and energy have rebounded. While a new commodity price boom is a long way away the rebound is pushing up national income. Amongst other things, this along with booming export volumes is leading to a dramatic shrinkage in Australia’s current account deficit which could soon be in surplus for the first time since the 1970s and the associated surge in resource company profits could knock $8-10bn pa off the Federal budget deficit.

  • Sixthly, public infrastructure investment is ramping up strongly, in response to state infrastructure spending particularly in NSW and the ACT much of which is financed from the privatisation of existing public assets.

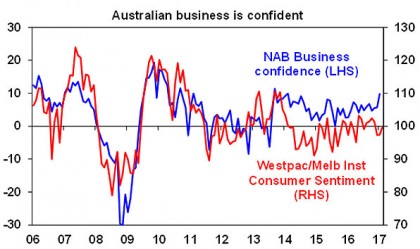
  • Finally, there are signs of life in non-mining investment. In terms of fundamental drivers borrowing costs have been low for some time but business confidence is reasonably high, profits for non-resource companies are growing around 5% per annum and capacity utilisation is up from its lows. While mining investment plans for the financial year ahead are around 30% below such plans a year ago, plans for non-mining investment are actually up 7%.

Australian business is confident
Source: National Australia Bank, Westpac/MI, AMP Capital

Overall, recession is likely to continue to be avoided and economic growth is likely on its way back to near 3% this year.

Interest rates on hold

There remains a case for another RBA interest rate cut: the $A remains too high, slowing housing investment at a time when mining investment is still falling risks slower economic growth, banks are under pressure to raise rates out of cycle and inflation risks staying lower for longer as wages growth remains weak. But against this, growth has bounced back nicely in the December quarter, national income is up and RBA concerns about the threat to household financial stability that may flow from more rate cuts imply a high hurdle to cutting rates again. As a result we are removing the rate cut we had expected for May and now expect rates to be on hold this year. That said if the RBA is to do anything on rates this year a cut is more likely than a hike. A rate hike is unlikely until later next year.

Profit growth goes back to positive

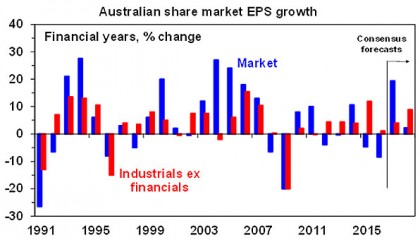
The Australian December half profit reporting season confirmed a very strong return to profit growth. However, this dramatic turnaround has been driven by resources stocks with more modest growth for the rest of the market. In terms of some key statistics: 45% of companies results have exceeded earnings expectations which is around the long term norm, 59% of companies have seen profits up from a year ago with a median gain of 4% year on year and the focus has remained on dividends with 80% of companies either increasing or maintaining their dividends which is a positive sign of corporate confidence in the outlook.

Consensus profit expectations for the overall market for this financial year were revised up by around 2% through the reporting season to a strong 19%. The upgrade has all been driven by resources companies which are on track for a rise in profit of 150% this financial year reflecting the benefits of higher commodity prices and volumes on a tighter cost base. Profit growth across the rest of the market is likely to be around 5% with mixed bank results and constrained revenue growth for industrials. Outlook comments have generally been positive and as a result the proportion of companies seeing earnings upgrades has been greater than normal. While the bounce in resource profits will slow, profit growth for industrials is likely to pick up reflecting stronger economic growth.

Australian share market EPS growth
Source: UBS, AMP Capital

Implications for investors

A return to reasonable growth underpinning reasonable profit growth is positive for Australian assets. With Australian shares up 12% since the US election and trading on a forward price to earnings multiple of 15.5 times which is above the long term average, the market is vulnerable to a further short term consolidation or correction. However, the improvement in profits – which is likely to broaden to industrials – should underpin a rising trend in the market on a 6-12 month horizon.

About the Author

Dr Shane Oliver, Head of Investment Strategy and Economics and Chief Economist at AMP Capital is responsible for AMP Capital’s diversified investment funds. He also provides economic forecasts and analysis of key variables and issues affecting, or likely to affect, all asset markets.

Important note: While every care has been taken in the preparation of this article, AMP Capital Investors Limited (ABN 59 001 777 591, AFSL 232497) and AMP Capital Funds Management Limited (ABN 15 159 557 721, AFSL 426455) makes no representations or warranties as to the accuracy or completeness of any statement in it including, without limitation, any forecasts. Past performance is not a reliable indicator of future performance. This article has been prepared for the purpose of providing general information, without taking account of any particular investor’s objectives, financial situation or needs. An investor should, before making any investment decisions, consider the appropriateness of the information in this article, and seek professional advice, having regard to the investor’s objectives, financial situation and needs. This article is solely for the use of the party to whom it is provided.

A year ago there was a long global worry list and high on that list was China. A nearly 50% collapse in Chinese shares, uncertainty about the Renminbi, slowing Chinese growth, fears of a massive oversupply of residential property and uncertainty about the intentions of Chinese policy makers had left many convinced China was heading for the long predicted “hard landing”. But since then it seems China worries have receded. So what happened? Put simply the Chinese economy stabilised. But what’s the outlook for China now? And what does this mean for investors and Australia?

Chinese growth has stabilised and inflation is back

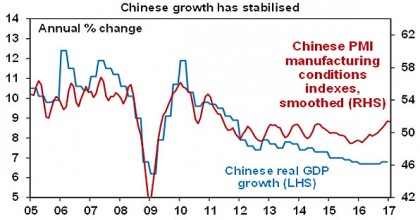
The continuing growth slowdown in China through 2014 and 2015 caused much angst and as a result Chinese economic policy swung from mild tightening towards stimulus with rate cuts, fiscal stimulus and an easing in measures designed to cool the property market. This worked. As can be seen in the next chart Chinese growth stabilised through 2016 at 6.7% and perked up to 6.8% year-on-year in the December quarter. Business conditions PMIs point to solid Chinese growth continuing into this year.

Chinese growth has stabilised
Source: Bloomberg, AMP Capital

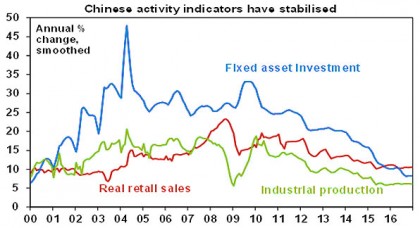
Industrial production and consumer spending have been stable. While investment has been softer, it looks likely to surge this year reflecting a jump in infrastructure projects. Excavator sales and power consumption have perked up.

Chinese activity indicators have stabilised
Source: Thomson Reuters, AMP Capital

While there is a perennial debate about how reliable Chinese growth data is, a strong rebound in commodity prices from their lows around a year ago (iron ore up 140%, copper up 43%, oil up 100%) – while partly also due to other things – supports the notion of solid Chinese growth.

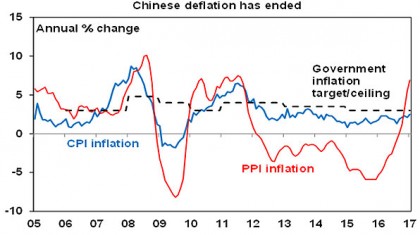
With this turnaround has also come an upswing in Chinese inflation, with CPI inflation rising to 2.5% year on year and producer price inflation rising to 6.9% up from -5.9% through 2015. While producer price inflation will likely slow back down again unless commodity prices continue to rise at the same rate, deflationary pressures have clearly faded in China.

Chinese defaltion has ended
Source: Bloomberg, AMP Capital

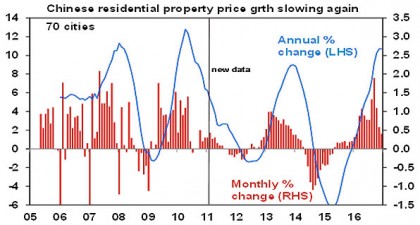
Finally, the Chinese residential property market has swung from a mild slump in 2014-15 through another boom which is now starting to cool again. The “ghost cities” paranoia of a few years ago has clearly not come to much with property demand returning once the property cooling measures of a few years ago were relaxed and prices taking off again.

Chinese residential property price grth slowing again
Source: Bloomberg, AMP Capital

Policy swings back to modest tightening

With the stabilisation in growth and rise in inflation the focus of Chinese policy makers has swung back to containing debt and home prices. Over the last six months property cooling measures have been ramped up again, government spending has slowed down and the PBOC has put through a modest mostly 0.1% lift in short term money market rates.

Growth and inflation outlook

Policy tightening is likely designed to keep a lid on a further acceleration in economic growth but it is unlikely to get tight enough to slow growth substantially. We expect Chinese growth this year of around 6.5% and consumer inflation of 2.5 to 3%.

Key risks facing China

There are four key risks facing China. First, the Chinese policy tightening now underway could lead to another scare regarding the Chinese growth outlook. By the same token though the experience of the last few years tells us that the Chinese leadership’s tolerance for a significant growth slowdown is low. This is particularly likely to be the case with the Government wanting to look good ahead of the 19th National Congress of the Communist Party later this year.

Second, with the residential property cycle starting to slow again, fears may return that the property market is at last heading into a crash. Time will tell but it’s debatable as to whether China has really had a generalised housing bubble: household debt is low at around 40% of GDP; house prices haven’t kept up with incomes; and while there’s been excessive supply in some inland cities this is not so in first tier cities where there is an undersupply of affordable housing and the quality of the housing stock is low necessitating replacement. So the property crash fears continue to be exaggerated I think.

Thirdly, concern remains regarding China’s rapid debt growth. While it has slowed to around 15%, it’s still excessive relative to growth in the Chinese economy. However, several considerations suggest the risks are manageable. First, strong growth in debt reflects China’s near 50% savings rate with savings mainly being recycled via the banks and hence as debt. The solution is to consume more and channel a greater share of saving into equities rather than through banks. This will take time. Second, China is only borrowing from itself not from foreigners. Finally, high corporate debt reflects an element of fiscal policy and would be subject to Government support.

Finally, the risk of a trade war – which would be bad for China – has risen under President Trump. So far though Trump is talking of a “constructive relationship” and “mutual benefits” with China which is a positive sign.

Our assessment remains that these risks are manageable. The Chinese Government has plenty of firepower to support growth. So a hard landing in growth remains unlikely at this stage.

The Chinese share market

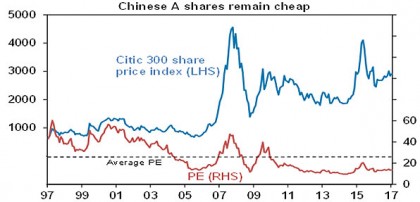
Since its low in January last year the Chinese share market has recovered around 20%. But it is still far from expensive. Chinese mainland shares (or A shares) are trading on a forward price to earnings multiple of 13 times and Chinese shares listed in Hong Kong (or H shares) have a forward PE of just 8 times.

The Chinese share market cheap
Source: Thomson Reuters, AMP Capital

With valuations looking reasonable and growth set to continue, Chinese shares should provide reasonable returns. However, a shift to policy tightening will constrain the rate of capital growth.

Why has the iron ore price surged higher?

After falling 80% from its high of $US192/tonne in 2011 to its low of $US38 in November 2015 the iron ore price has surprised most and surged to more than $US90. A range of factors have played a role in this including: stronger construction demand in China; a switch to higher quality iron ore to cut down on coking coal usage; reduced lower grade iron ore output from Chinese mines due to capacity closures, and; some supply disruptions and speculative activity on Chinese commodity exchanges. Some of these will reverse on a 12 month horizon but the surge does have a fundamental element and, with Chinese infrastructure projects still ramping up, the iron ore price could have more upside in the short term to maybe $US100 before the price settles a bit lower. A sign of the top may be when resource analysts raise their iron ore price forecasts above the current spot price. With consensus forecasts around $US60 they are a long way from that just now.

Implications for Australia – it’s not 2003 but still good

The surge in the iron ore price along with other commodity prices has pushed up Australian export prices and pushed the trade surplus to record highs. This is unlikely to lead to the sort of boost the economy saw last decade where surging resource commodity prices year after year led to surging Federal taxation revenue (and annual tax cuts) and a massive mining investment boom. This time around tax cuts are less likely due to tougher budgetary conditions, mining companies are just recovering from the last mining investment boom, the $A is starting from a much higher level than at the start of last decade ($US0.77 versus $US0.48) – and so the constraint on the non-mining part of the economy is much higher now – and finally we are unlikely to see year after year of bulk commodity price increases given structurally lower growth in China and a surge in the supply potential of commodities. Nevertheless, rising national income is better than falling national income and it supports the view that the hit to the economy from the mining boom collapse has largely run its course. All of which should help a return to GDP growth around 3%. The iron ore price at $US90/tonne will also knock nearly $9bn off the annual Federal budget deficit.

Key implications for investors

  • Chinese shares remain reasonably good value from a long term perspective, but beware their short term volatility.

  • The stabilisation in Chinese growth and higher commodity prices is positive for Australia’s economy and assets.

Source: AMP Capital 16 Feb 2017

About the Author

Dr Shane Oliver, Head of Investment Strategy and Economics and Chief Economist at AMP Capital is responsible for AMP Capital’s diversified investment funds. He also provides economic forecasts and analysis of key variables and issues affecting, or likely to affect, all asset markets.

Important note: While every care has been taken in the preparation of this article, AMP Capital Investors Limited (ABN 59 001 777 591, AFSL 232497) and AMP Capital Funds Management Limited (ABN 15 159 557 721, AFSL 426455) makes no representations or warranties as to the accuracy or completeness of any statement in it including, without limitation, any forecasts. Past performance is not a reliable indicator of future performance. This article has been prepared for the purpose of providing general information, without taking account of any particular investor’s objectives, financial situation or needs. An investor should, before making any investment decisions, consider the appropriateness of the information in this article, and seek professional advice, having regard to the investor’s objectives, financial situation and needs. This article is solely for the use of the party to whom it is provided.

I recently had an ‘a-ha’ moment. I was sitting in yet another room full of women talking about the importance of gender diversity. It dawned on me that we’ve talked about diversity for so long that we’ve become dulled to the issue. We’ve heard the arguments so many times that we’ve stopped listening.

Is gender fairness a secret to investment outperformance?

Advisers might have a similar numbed response: what has gender diversity got to do with delivering my clients’ financial goals?

As it turns out, a lot. Research shows that companies and fund managers with more women deliver better performance. That, of course, means better performance for your clients’ portfolios.

In an environment of low growth and low returns, focusing on gender diversity provides an edge.

And in a broader sense, to reignite the gender debate we need to reframe the gender issue from being about ‘fairness’, or being ‘smart’ — to being about the amazing benefits women bring to companies.

A long way, but more work to be done

I started at AMP 32 years ago when I joined the graduate recruitment program. It surprises me that after all this time we’re still talking about gender diversity.

There is no doubt that progress has been made. In 1984 Australia passed the Sex Discrimination Act to eliminate discrimination based on sex, marital status or pregnancy. Initiatives in Australia over the last five years have resulted in greater gender diversity on company boards. Pleasingly, in 2015 almost half of all new board appointments in Australia were women.

But much remains to be done. Most Australian boards and management teams are still predominantly male. The national gender pay gap in Australia is currently 17.3 per cent, so by the time women enter retirement they have superannuation balances around half that of men.

In Australia, women comprise 46 per cent of all employees, but despite women achieving higher levels of education than men, women hold only 14 per cent of chair positions, 15 per cent of CEO positions and 27 per cent of key management personnel positions.

From the right thing to the smart thing

With more to be done how do we overcome gender complacency? How do we reignite the gender debate?

I believe we need to start by highlighting the real results that gender diversity delivers. In the case of advisers, that’s smarter and better companies and funds to invest in, and better outcomes for clients.

When society first focussed on diversity and anti-discrimination based on gender, it was a moral and ethical issue. But we shouldn’t see it only as the ‘right’ thing to do, but increasingly the ‘smart’ and also the ‘necessary’ thing to do.

More women, better decisions

AMP Capital has long argued that advisers and investors benefit from digging deeper and looking beyond financial statements when valuing companies. The greatest driver of company value is not what you can see, but what lies beneath the surface.

If you accept that a company’s value is largely driven by the actions of its people, it follows that teams best able to generate strong returns for shareholders will be those that are happy, engaged, collectively intelligent but also cognitively diverse.

Research has found that when women are added to decision-making groups, the groups are likely to have increased focus on ethics, risk management, reputation and cooperation, as well as on the context of the problem and the broader impact of decisions.

That’s vital in a more complicated and fast-moving world. Companies are likely to be most successful when they have assembled diverse teams who not only understand customers and disrupters but can also brainstorm what can (and can’t) be done.

More women, better performance

What does that mean for company performance? The research is clear that gender diversity leads to better results.

Credit Suisse and Catalyst research shows that, even after adjusting for sectoral impacts, companies with more women generally demonstrate higher returns on assets, higher return on sales and higher return on invested capital. These companies also exhibit lower risk of insolvency and higher dividend payouts.

A 2015, McKinsey report, which looked at 366 public companies across the world, found companies in the top quartile for gender diversity are 15 per cent more likely to have financial returns above their national industry median. And on AMP Capital’s own assessment, there is a positive correlation between a company’s governance quality and the number of women directors.

The research also has implications for allocations to investment teams. If cognitive diversity improves decision making, it is logical to conclude that cognitively diverse investment teams will make better investment decisions.

Since investing began, trading rooms have tended to be full of competitive men, testosterone and risk-taking. While women are yet to have a significant presence, it is anticipated that when their numbers grow the culture will become a more socially perceptive one, with more focus on collaboration and inclusiveness and less on risk-taking.

So as advisers and investors, it is recommended you focus on investing in companies – and indeed investment managers — that promote gender diversity.

A role for all us

But more broadly, we need to remember that more needs to be done to create a fairer society, which as we’ve seen will deliver clients a broader investable universe of smarter more successful companies.

Yes, good progress has been made, but there is some way to go before women make up 30 per cent of every Australian board of directors.

Ideally advisers and investors should get involved by encouraging companies to promote an inclusive culture from the CEO down, make diversity a KPI and convince men that they have nothing to lose.

Companies need to level the playing field and make sure each person’s voice is heard regardless of gender, decrease bias in recruitment with gender balanced short-lists and interviewing panels, and pay men and women equally.

AMP Capital, for example, encourages the companies we invest in to address roadblocks such as unconscious bias and to cast the net more widely when recruiting. For the pool of talented women to be developed and recognised, there needs to be a clear focus on pay parity and the opportunities for women to gain executive experience.

Advisers and investors have a key role to play in driving these changes. Not only will we all benefit from a fairer society, but your clients will also benefit from smarter companies and better investment returns.

Author: Karin Halliday, Senior Manager, Corporate Governance, AMP Capital

Source: AMP Capital 10 Feb 2017

Important note: While every care has been taken in the preparation of this document, AMP Capital Investors Limited (ABN 59 001 777 591, AFSL 232497) and AMP Capital Funds Management Limited (ABN 15 159 557 721, AFSL 426455) make no representations or warranties as to the accuracy or completeness of any statement in it including, without limitation, any forecasts. Past performance is not a reliable indicator of future performance. This document has been prepared for the purpose of providing general information, without taking account of any particular investor’s objectives, financial situation or needs. An investor should, before making any investment decisions, consider the appropriateness of the information in this document, and seek professional advice, having regard to the investor’s objectives, financial situation and needs. This document is solely for the use of the party to whom it is provided.

It’s now a decade since the first problems with US sub-prime mortgages started to appear and nearly eight years since share markets hit their global financial crisis lows. From those lows in 2009 lows US shares are up 239%, global shares are up 167% and Australian shares are up 80% (held back by relatively higher interest rates, the absence of money printing, the plunge in commodity prices from their 2011 highs and the high $A). An obvious question is how close the next downturn is, which ultimately relates to where we are in the investment cycle.

The long US cyclical bull market

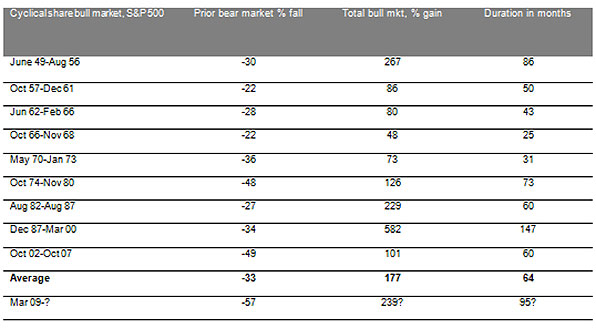
Where we are in the investment cycle is particularly pertinent in relation to the US. The cyclical bull market in US shares that started in March 2009 will be eight years old in March. It’s the second longest cyclical bull market since World War Two in terms of time and the third strongest in terms of percentage gain. See the next table.

Cyclical bull markets in US shares since WW2

click to enlarge

I have applied the definition that a cyclical bull market is a rising trend in shares that ends when shares have a 20% or more fall (ie, a cyclical bear market). Source: Bloomberg, AMP Capital.

Similarly, according to the US National Bureau of Economic Research the current US economic expansion that started in June 2009 at 92 months old is the fourth longest since 1929 and compares to an average expansion of 70 months. With the US cyclical bull market and economic expansion both now long in the tooth, some fear that US shares are vulnerable to another bear market and by implication given the direction setting influence of the US share market, global and Australian shares would be vulnerable too. A related concern is that, with the US economic expansion already longer than normal, any stimulus that President Trump may provide risks overheating the US economy and much higher interest rates which could bring on a bear market.

The investment cycle

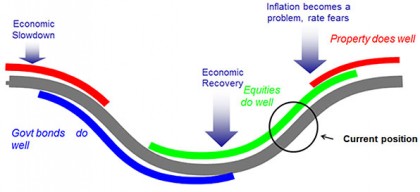
The next chart shows a stylised version of the investment cycle where the thick grey line represents the economic cycle.

The investment cycle

Source: AMP Capital

A typical cyclical bull market in shares has three phases:

  • Scepticism – Phase 1 normally starts when economic conditions are still weak and confidence is poor, but smart investors start to see value in shares helped by ultra easy monetary conditions, low interest rates and low bond yields.

  • Optimism – Phase 2 is driven by strengthening profits as economic growth turns up and investor scepticism gives way to optimism. While monetary policy may start to tighten, it is from very easy conditions and will remain easy as inflation remains low. Therefore, bond yields may drift higher but not enough to derail the cyclical bull market in shares.

  • Euphoria – Phase 3 sees investors move from optimism to euphoria helped by strong economic and profit conditions which pushes shares into overvalued territory. Meanwhile, strong economic conditions drive signs of economic excess – overinvestment, full capacity utilisation, surging private sector debt, high and surging inflation – which forces central banks to move into tight monetary policy, in turn pushing bond yields significantly higher. The combination of overvaluation, investors being fully loaded up on shares and tight monetary policy sets the scene for a new bear market.

Typically the bull phase lasts 3-5 years. But it varies depending on how quickly recovery precedes, excess builds up, inflation rises and extremes of overvaluation and investor euphoria appear. As a result “bull markets do not die of old age but of exhaustion”.

So where are we now in the investment cycle?

So right here the big question is: are we in the “euphoria” phase that ultimately leads to the “exhaustion” of the cyclical bull market in shares and the next bear market? The best way to look at this is to look at economic conditions, monetary conditions, share market valuation and investor sentiment and positioning:

Firstly, in terms of economic conditions it’s hard to argue we are in the “euphoria” phase. There are few signs of economic excess:

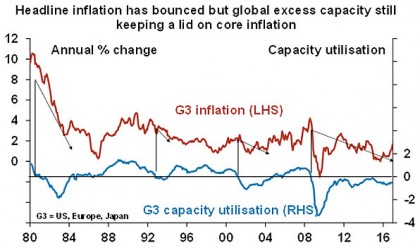
  • While headline inflation is rising globally this largely reflects the bounce in oil prices. Core inflation in major countries ranges between zero (Japan) to 1.7% (US), i.e. far from out of control.

  • After years of below trend growth globally, spare capacity still remains and this will constrain core inflation. Similarly wages growth remains depressed even in the US (at around 2.5% year on year) despite a tighter labour market.


Source: Bloomberg, AMP Capital

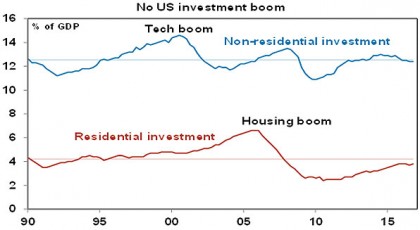
  • There is no sign of overinvestment globally – in fact there has been too little investment. While the US recovery is further advanced, even here business investment (excesses in which preceded the tech wreck) and residential property investment (excesses in which preceded the GFC) are around or below their long term averages relative to GDP.


Source: Thomson Reuters, AMP Capital

  • Overall private sector debt growth is modest in most countries (except for corporate debt in the US and China).

Secondly, global monetary conditions remain easy and in the absence of broad based excess (in growth, debt, or inflation) look likely to remain so. Yes the Fed is likely to hike rates more aggressively this year but it’s still from a very easy base and other central banks (including the RBA) are either on hold or easing. So a shift to tight money that brings an end to the economic cycle looks a fair way off.

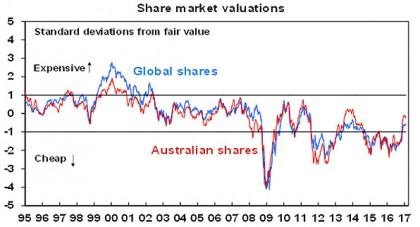
Thirdly, share market valuations are mostly okay. Sure, measured in isolation against their own history shares are no longer cheap. In fact, forward price to earnings multiples in the US and Australia are above long term averages. However, once the gap between share market earnings yields and still low bond yields is allowed for, shares are fair value to cheap depending on the market (next chart).


Source: Bloomberg, AMP Capital

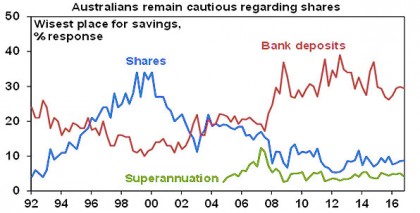
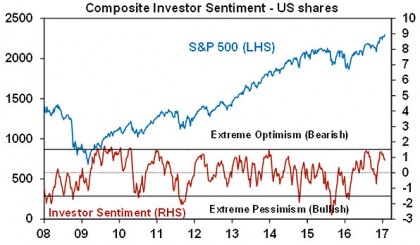
Fourthly, while short term investor sentiment is excessively bullish long term measures of positioning are not. In the US the huge investor flows into bond funds over the last few years have yet to reverse in favour of shares. In Australia sentiment towards shares as a wise destination for savings remains low and investors still prefer bank deposits. No euphoria here.


Source: Westpac/Melbourne Institute, AMP Capital

Finally, while the US cycle is more advanced, it could be argued that the 19% fall in US shares in mid-2011 was a bear market. So the bull market in US shares is perhaps not so old after all! Moreover, major non-US share markets and Australian shares did have a bear market in both 2011 and 2015-16 so their cyclical bull markets are not old at all. In this regard European and Japanese share markets are relatively attractive thanks to cheaper valuations and still dovish central banks.

Overall, we are still not seeing the signs of excess, euphoria and exhaustion that typically come at cyclical economic and share market peaks. So barring some sort of external shock, the cyclical bull market in shares looks like it still has further to go – particularly if global economic growth returns to more normal levels which in turn will help earnings.

With regard to any Trump fiscal stimulus, this analysis suggests there is still a bit of room for it before it causes the US economy to overheat. Particularly if the US dollar continues to trend higher, which takes some off the pressure of the Fed to raise rates. In any case it’s looking likely that fiscal stimulus in the US won’t hit till late this year and will unlikely to be more than 1% of US GDP given the constraints Congress is likely to impose. In fact the focus is more likely to be on providing a boost via economic reforms – deregulation, tax reform and inducements to invest – rather than traditional stimulus.

Investment implications

First, while corrections should be anticipated – with Trump and upcoming Eurozone elections being potential triggers – we still appear to be a long way from the peak in the investment cycle.

Second, non-US share markets and economies – notably Japan and Europe – are less advanced in their cycles and so provide opportunities for investors.

Source: AMP Capital 9 Feb 2017

About the Author

Dr Shane Oliver, Head of Investment Strategy and Economics and Chief Economist at AMP Capital is responsible for AMP Capital’s diversified investment funds. He also provides economic forecasts and analysis of key variables and issues affecting, or likely to affect, all asset markets.

Important note: While every care has been taken in the preparation of this article, AMP Capital Investors Limited (ABN 59 001 777 591, AFSL 232497) and AMP Capital Funds Management Limited (ABN 15 159 557 721, AFSL 426455) makes no representations or warranties as to the accuracy or completeness of any statement in it including, without limitation, any forecasts. Past performance is not a reliable indicator of future performance. This article has been prepared for the purpose of providing general information, without taking account of any particular investor’s objectives, financial situation or needs. An investor should, before making any investment decisions, consider the appropriateness of the information in this article, and seek professional advice, having regard to the investor’s objectives, financial situation and needs. This article is solely for the use of the party to whom it is provided.

Since the US election last November US and global shares rallied around 8% and Australian shares rallied around 12% to their recent highs. Related to this the US dollar, bond yields and some commodity prices also pushed significantly higher. Optimism regarding Donald Trump’s pro-growth policies were not the only factor playing a role in this rally – global economic indicators have improved significantly in most regions – but it certainly played a role. With Trump now inaugurated as President we are at the point where that optimism is being tested.

Donald Trump has only been President for two weeks but it seems that he has already done a lot with numerous major announcements. So far the key moves relate to: minimising the economic burden of Obamacare; reviewing new regulations; preventing non-government organisations that perform abortions from receiving Federal funding; withdrawing the US from the Trans Pacific Partnership free trade deal; freezing Federal hiring; moving towards approving the Dakota and Keystone XL oil pipelines; speeding up approvals for high priority infrastructure projects; reducing regulatory burdens facing manufacturers; directing the construction of a wall with Mexico; support for a “border adjustment tax”; and various restrictions around immigration – in particular a 90 day ban on travellers to the US from seven majority Islamic countries.

While these moves are basically consistent with his campaign policies, some have created considerable consternation in the US and globally. And Trump and his teams’ “thin skin” has led to various distractions – eg, around how many people attended his inauguration and “alternative facts”.

Initially investment markets reacted favourably after Trump’s inauguration as many of his orders were pro-business, but the travel ban has seen uncertainty creep in around whether the new administration knows what it is doing (the ban seems to have been poorly thought through in terms of implementation and legalities as it was not vetted by the bureaucracy first) and around how isolationist Trump is prepared to take the US. Quite clearly Trump is a different kind of US President to the norm. This note looks at the main issues of importance to investors.

Risks under President Trump

Donald Trump’s presidency comes with a number of risks:

  • He could make a major policy mistake – for example, some of his recent announcements don’t appear to have been well thought through (eg, the travel ban).

  • He could trigger a major global trade war which could adversely affect global growth. Or, in targeting countries with which the US runs a trade deficit and its NATO allies for not “paying their fair share”, he could threaten the flow of cheap funding that the US benefits from.

  • He could go the way of Nixon (impeachment, resignation) who was known for his thin skin and paranoia regarding the media – Trump seems to be making an enemy of much of the media who are no doubt likely to try and do their best to discredit him eg, around conflicts with his business interests, the Russian link or whatever.

  • His proposed fiscal stimulus risks a further budget and public debt blow out. When Ronald Reagan took over US public debt was 30% of GDP, now it’s over 100% and the budget deficit is likely to deteriorate in the years ahead thanks to the aging population. Or it could overstimulate the US economy causing a far more aggressive Fed.

  • Alternatively, Congressional constraints could mean that any fiscal stimulus is underwhelming and/or that he fails to relax the Dodd-Frank financial regulations. Achieving tax and spending changes will be easier for Trump as the Republicans have simple majorities in both houses of Congress which is all that’s required, but measures outside of the budget require 60 out of 100 Senate votes which will necessitate support from some Democrats.

  • His jawboning of US companies to keep production in the US could backfire leading to low US productivity. The track record of governments trying to direct companies is not great. But this will only become apparent over the long term and if production does remain in the US it will increasingly be dominated by robots anyway.

Assessing Trump

These risks are real but shouldn’t be exaggerated. In assessing Trump there are several key things investors need to allow for.

First, all new administrations make mistakes initially reflecting inexperience and the bureaucracy not yet in sync with the President. And with Trump and his team less experienced than most and the bureaucracy perhaps even less on side than normal, the mistakes are likely to be greater than normal. But as the process improves with the bureaucracy moving into line with the Trump administration, policy announcements should look smoother and more considered.

Second, he is not a traditional Republican president. Some of his policies are classic Republican – lower taxes, deregulation – but some borrow from the left – infrastructure spending or even old fashioned protectionism. Despite some comparisons to Ronald Reagan he lacks Reagan’s consistent ideology. He will follow his own course.

Third, his support base is middle America. Supporting them with jobs and higher wages is critical. Getting stuck in a trade war with China and Mexico that just pushes prices up at Walmart by 20% won’t go down well with his support base.

Fourth, he has a loud and more direct approach to communication – what some call a huge mega phone. And he has no constraint in using it against politicians or companies who get in his way. Related to this his open mouth approach is prone to reversal – think about his comments about locking Hilary Clinton up, border adjustment tax (initially “too complicated” but now working on it) and torture (initially supporting it and then leaving it to his Defence Secretary). We have to get used to a lot more noise coming out of Washington, but the key is that much of it will be just that: “noise”.

Fifth, he is a businessman who prides himself on his negotiating skills. So for example the imposition of a tariff on imports from China or Mexico may just be the opening gambit in a negotiation designed to extract a better trade deal for the US rather than necessarily being the final outcome.

Finally, his time to get his legislative agenda through Congress is limited. The President’s party normally loses control of it in the mid-term elections (as Obama did after his first two years) – so he doesn’t want to waste too much time.

On balance

Given all this I remain of the view that despite the rough start the pragmatic growth focussed Trump will ultimately dominate the populist Trump. But we have to allow that it will take a while for pro-growth policies to be legislated – eg, the President and Congress may not agree a tax reduction package until later this year – and that fears of trade war are likely to get worse before they get better as Trump embarks on a tough negotiating stance. This should ultimately be supportive of US/global growth but there will be volatility (and noise) along the way.

Implications for investment markets

After their large gains from around the US election, share markets, the US dollar and bond yields all entered 2017 with a degree of vulnerability. Shares, for example, had become technically overbought, and short term measures of investor sentiment had risen to levels of optimism that are often associated with a correction. See the next chart for US shares which tracks a measure of short term investor sentiment based on surveys of investor optimism and demand for option protection against the US share market.


Source: Bloomberg, AMP Capital

Since Trump’s election played a part in the rally, it was always likely that a period of uncertainty about what Trump would do – whether we get the pragmatist or the populist – could drive this, and this seems to be the case. This in fact is not out of line with the historical experience where US shares in the first February of new presidents have had an average decline of 4% since Hoover in 1929. Of course other factors played a role: with the Great Depression for Roosevelt; the start of the tech wreck for G W Bush; and the tail end of the GFC for Obama exaggerating the declines they saw. But the pattern of an initial period of uncertainty, often around communication mistakes, is apparent.


Source: Thomson Reuters, AMP Capital

However, despite the likelihood of a bout of short term market turbulence we see share markets trending higher over the next 6-12 months helped by okay valuations, continuing easy global monetary conditions, some acceleration in global growth, rising profits in both the US and Australia, and as Trump’s pro-growth policies start to impact.

A brief comment on border adjustment tax

Debate about a “border adjustment tax” in the US is heating up, but what is it? Basically many countries including Australia and Europe have a consumption tax – which only taxes goods and services consumed in the country. So imports are taxed and exports aren’t. The US has state based sales taxes but these are not the same as a consumption tax. In part to address the imbalance and at the same time lower America’s corporate tax rate from a globally high 35%, House Republicans have been working to move the US corporate tax system to only tax activity relating to goods and services consumed in the US. This would entail taxing imports and rebating tax on exports, ie, undertaking a “border adjustment”, just like when tourists show up at the airport when leaving Europe for a tax refund on goods they have bought there. Such an approach would make it harder for companies to lower their taxable income (via transfer pricing), redress the imbalance where the US does not have a consumption tax but other countries do, and because America imports more than it exports it would enable a lower corporate tax rate with talk of a 20% rate.

Trump initially rejected the idea as being “too complicated” but appears to have come round to it lately. However, it’s not clear Republican senators would support it and there is a long way to go. But if it does get up it would be a huge boost for US exporters (eg, Boeing) and a huge negative for importers (eg, Walmart) and would put significant upwards pressure on the $US which could then \/home\/clientcomm2018budget\/public_htmlify the border adjustment. Of course it may also be subject to a World Trade Organisation challenge (although the US may argue most other countries do the same with their consumption taxes) and it would put significant pressure on other countries to move to the same system.

At the very least a 20% US corporate tax rate would only add to the pressure on Australia to lower its corporate tax rate.

Source: AMP Capital 02 Feb 2017

About the Author

Dr Shane Oliver, Head of Investment Strategy and Economics and Chief Economist at AMP Capital is responsible for AMP Capital’s diversified investment funds. He also provides economic forecasts and analysis of key variables and issues affecting, or likely to affect, all asset markets.


Important note: While every care has been taken in the preparation of this article, AMP Capital Investors Limited (ABN 59 001 777 591, AFSL 232497) and AMP Capital Funds Management Limited (ABN 15 159 557 721, AFSL 426455) makes no representations or warranties as to the accuracy or completeness of any statement in it including, without limitation, any forecasts. Past performance is not a reliable indicator of future performance. This article has been prepared for the purpose of providing general information, without taking account of any particular investor’s objectives, financial situation or needs. An investor should, before making any investment decisions, consider the appropriateness of the information in this article, and seek professional advice, having regard to the investor’s objectives, financial situation and needs. This article is solely for the use of the party to whom it is provided.

Since the global financial crisis (GFC), one of the dominant patterns in global economic policy has been the search for more tools to provide stimulus in an environment where low growth and low inflation have proven extremely persistent.

Faced with the difficulty of what to do when cash rates reach the lower bound of zero, central bankers have responded with attempts to twist the yield curve; purchases of government bonds, corporate bonds and equities; direct loans into the banking system; and most recently, negative interest rates. In some countries, these moves have been accompanied by explicit requests from the central bank that governments become more active in fiscal policy.

These non-traditional policy tools reflect a degree of desperation, as the traditional tool of monetary policy – cash rates – have reached their effective limits. When a central bank reduces interest rates, it limits its ability to provide further stimulus going forward. Given there is a lower bound on the cash rate, the decision to cut rates today means one more cut that cannot be delivered in the future, should economic conditions worsen.

In effect, by using policy flexibility today, policy makers, with a finite number of ways to deliver stimulus, reduce their future flexibility to loosen policy. Policy makers have embraced quantitative easing and negative interest rates to increase the number of policy tools available and therefore generate more flexibility for the future.

Flexibility for policy makers is essential if they are to respond to further growth downturns or systemic shocks. Additionally, in an environment where central banks are often struggling to meet their inflation mandates, a perceived inability to deliver further stimulus goes to the heart of central bank credibility itself, with low inflation expectations becoming entrenched as a result.

The Policy Inflexibility Index

At AMP Capital, our belief is that a rigorous and robust investment process is the key to delivering great investor outcomes. To that end, we have developed a method of analysing economies and markets using quantitative analysis as the foundation. We are continuing that tradition by introducing our Policy Inflexibility Index, which we have developed and calculated across a range of countries. Through this Index we seek to model the degree of policy choices, available to any given country, that support growth and inflation expectations in a systematic way. The index is based on the following inputs:

  • Does the (relevant) central bank still have room to cut, or has a lower bound been reached?

  • Are long term yields relatively high compared to the cash rate? A steep yield curve indicates there is room to bring term yields down. This can be achieved through a variety of methods ranging from forward guidance through to asset purchasing programmes, such as quantitative easing.

  • Is the currency expensive versus fair value? Lower exchange rates are stimulatory, and an expensive currency has greater potential to weaken in response to policy making.

  • Has the government been running surpluses, or only small deficits? A government in this situation is more able to stimulate activity by choosing to run larger deficits for a period.

  • What is the overall debt level of the government? A government with low levels of debt is likely to be able to sustain larger deficits over a longer period.


Figure 1 shows the Policy Inflexibility Indices for Australia, the EU, Japan and the United States. There are a number of notable observations:

Australia, with the highest cash rate, has not had to engage in any unconventional monetary policy and has the most favourable starting point from a fiscal point of view. Consequently, Australia has considerably more policy flexibility than the other countries. However, the extended easing cycle by the RBA has had some impact in limiting future choices for further stimulus.

The US has significantly more policy flexibility than either Europe or Japan. This is partly due to having commenced a hiking cycle. What has been more impactful in terms of future flexibility has been the substantial rise in the value of the USD; while this has a tightening impact on policy now, the rally provides scope for a more substantial decline should growth expectations falter. Additionally, the US fiscal position has substantially improved since the large deficits that were run following the collapse of Lehman Brothers, providing greater scope for additional fiscal spending in the future, if needed.

Although Europe and Japan face similar overall constraints with policy flexibility, the underlying reasons are different. Both have low cash rates and relatively flat yield curves owing to extensive asset purchase programs. However, in the case of Japan, the Yen remains more expensive against valuation models, allowing greater potential for future weakness. For Europe, the overall fiscal position of the Eurozone is somewhat more positive, allowing for further stimulus from government spending.

Applications and Limitations

It remains to be seen whether new policy tools will be found. Policy makers have been remarkably inventive in finding new approaches to deliver easing in the years since the GFC. Had this index been constructed prior to that period, we would not have considered the need to factor in the potential for quantitative easing. It is likely that the index will need to be expanded in the future to handle further developments in unconventional policy.

Additionally, understanding whether a country has room to move on policy is not the same as determining whether it will choose to do so. For example:

The European fiscal situation, in aggregate, is strengthened by fiscal stance of Germany, where low deficits and debt levels act to improve the score of the Eurozone as a whole. While the index seeks to capture the capacity of policy makers to influence the cycle, it does not capture their willingness to do so. This is exemplified by the reluctance of Germany to run budget deficits, despite low growth and inflation; which has hindered the recovery of the Eurozone. Similarly, while Australia’s relative positive fiscal position allows for future stimulus, if there is a lack of political will to run larger budget deficits in an environment of deteriorating growth, the policy flexibility will remain unused. Nonetheless, the potential for further stimulus is paramount for policy makers seeking to maintain their inflation credibility.

Finally, all these measures are somewhat subjective. The true lower bound for effective cash rates is likely to be determined in hindsight. While it is likely that a currency that is expensive against fundamentals is more likely to fall, this may not occur, despite the will of policy makers.

All that said, a country that has exhausted its policy tools finds itself in a difficult position. In such a scenario, policy makers are likely to be confronted by substantial challenges in smoothing out the growth cycle and maintaining inflation expectations. It seems clear that despite policy makers’ claims, both Japan and the Eurozone are close to the limits of what can be achieved through existing methods. Assets in countries with low levels of policy flexibility should have higher risk premiums in order to compensate for increased tail risk.

Authors: Ilan Dekell, Head of Macro & Andrew Scott, Senior Portfolio Manager, Macro

Source: AMP Capital 10 Jan 2017

Important note: While every care has been taken in the preparation of this document, AMP Capital Investors Limited (ABN 59 001 777 591, AFSL 232497) and AMP Capital Funds Management Limited (ABN 15 159 557 721, AFSL 426455) makes no representations or warranties as to the accuracy or completeness of any statement in it including, without limitation, any forecasts. Past performance is not a reliable indicator of future performance. This document has been prepared for the purpose of providing general information, without taking account of any particular investor’s objectives, financial situation or needs. An investor should, before making any investment decisions, consider the appropriateness of the information in this document, and seek professional advice, having regard to the investor’s objectives, financial situation and needs. This document is solely for the use of the party to whom it is provided. AMP Capital Funds Management Limited (AMP Capital) is the responsible entity of the AMP Capital Sustainable Australian Equity Fund and the issuer of the units in the Fund. To invest in this Fund, investors will need to obtain the current Product Disclosure Statement (PDS) from AMP Capital Investors Limited. The PDS contains important information about investing in the Fund and it is important that investors read the PDS before making a decision about whether to acquire, or continue to hold or dispose of units in the Fund. Neither AMP Capital, nor any other company in the AMP Group guarantees the repayment of capital or the performance of any product or any particular rate of return referred to in this document. Past performance is not a reliable indicator of future performance.