Downsizing to a coastal town or regional hub can hold lifestyle appeal, but don’t bank on it as a strategy to fund your retirement.

For many empty nesters, who may not have had the benefit of employer-paid super throughout their working life, the value of the family home can be seen as the jewel in the crown of a retirement funding strategy. After all, who cares about the Age Pension when you’re sitting on good real estate?

Swapping a high-maintenance family home for something smaller can give you more time for the things you enjoy, but keep in mind, it may not deliver the funds needed to enjoy a quality retirement.

Be aware of the ‘sea change’ downsides

The Association of Superannuation Funds of Australia (ASFA) did the sums recently, finding that downsizing for a sea or tree change has the potential to free up valuable home equity.

As a guide, sea changers moving from the Sydney metro area to the popular NSW retiree haven of Forster-Tuncurry could pocket up to $650,000 in home equity thanks to the difference in median home prices between the two regions.

However, there are drawbacks to consider. Choosing to live outside our big cities can make it harder to access specialist medical care – something that becomes more important as we age.

In addition, property price growth in our major state capitals tends to outpace regional areas. This matters because further down the track you may need to rely on home equity to fund the rising cost of aged care.

Remaining in the same city can be even less rewarding

Downsizing within the same city often provides fewer financial benefits than a sea or tree change. Property transaction costs in particular will eat away a substantial chunk of your home equity.

In Sydney for instance, the median apartment price is $762,509, and on that price you can expect to pay $29,807 in stamp duty alone. Once you’ve set aside sufficient proceeds to live off comfortably for the rest of your life, you could be faced with taking a very substantial downgrading in the type of housing or lifestyle you can afford.

The bottom line is that relying on the value of your home should not form the focus of your retirement plans.

A better solution? Your long-term plan

If you’re eager to cut housework or garden maintenance, downsizing can be a good option. However, if you’re hoping to fund a decent retirement, it may make much more sense to grow a separate pool of investments – preferably throughout your working life.

That said, good advice can make a measurable difference to your final nest egg at any life stage, and it’s never too late to get started.

The beauty of relying on your investments rather than your home to fund retirement, is that it gives you choices. If you don’t want to sell a much-loved family home, you don’t have to. And, if a more compact home is on your retirement radar, you can afford to make the move on your own terms, buying where and whenever you choose.

For tailored advice that lets you make the most of all your assets, not just your home and to enjoy a fulfilling retirement.Contact us on Phone: 07 5641 4134

Paul Clitheroe is a founding director of financial planning firm ipac, Chairman of the Australian Government Financial Literacy Board and chief commentator for Money Magazine.

Source : AMP 15 February 2018 

This article provides general information and hasn’t taken your circumstances into account. It’s important to consider your particular circumstances before deciding what’s right for you. Although the information is from sources considered reliable, we do not guarantee that it is accurate or complete. You should not rely upon it and should seek qualified advice before making any investment decision. Except where liability under any statute cannot be excluded, we do not accept any liability (whether under contract, tort or otherwise) for any resulting loss or damage of the reader or any other person.


Introduction

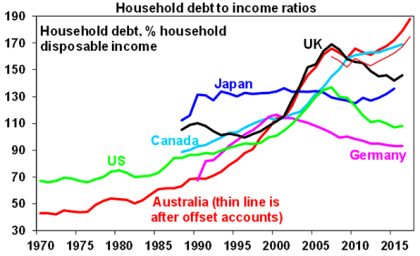
If Australia has an Achille’s heal it’s the high and still rising level of household debt that has gone hand in hand with the surge in house prices relative to incomes. Whereas several comparable countries have seen their household debt to income ratios pull back a bit since the Global Financial Crisis (GFC), this has not been the case in Australia. Some worry Australians are unsustainably stretched, and it is only a matter of time before it blows up, bringing the economy down at the same time. Particularly now that global interest rates are starting to rise. This note looks at the main issues.

Australia – from the bottom to the top in debt stakes

The chart below shows the level of household debt (mortgage, credit card and personal debt) relative to annual household disposable income for major countries.
 

Source: OECD, ABS, RBA, AMP Capital

While rising household debt has been a global phenomenon, debt levels in Australia have gone from the bottom of the pack to near the top. In 1990, there was on average $70 of household debt for every $100 of average household income after tax. Today, it is nearly $200 of debt (not allowing for offset accounts) for every $100 of after tax income.

Why has debt gone up so much in Australia?

The increase in debt reflects both economic and attitudinal changes. Memories of wars and economic depression have faded and with the last recession ending nearly 27 years ago, debt seems less risky. Furthermore, modern society encourages instant gratification as opposed to saving for what you want. Lower interest rates have made debt seem more affordable and increased competition amongst financial providers has made it more available. So, each successive generation since the Baby Boomers through to Millennials have been progressively more relaxed about taking on debt than earlier generations. 

It’s not quite as bad as it looks

There are several reasons why the rise in household debt may not be quite as bad as it looks:  

  • Firstly, higher debt partly reflects a rational adjustment to lower rates and greater credit availability via competition.

  • Secondly, household debt has been rising since credit was first invented. It is unclear what a “safe” level is. This is complicated because income is a flow and debt is a stock which is arguably best measured against the stock of assets or wealth.

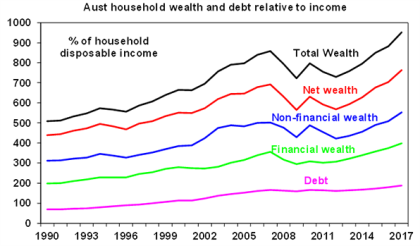
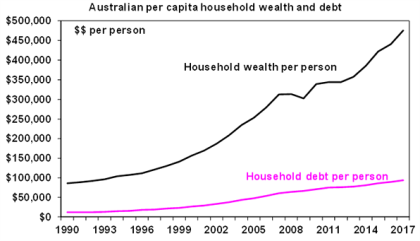
  • And on this front, the rise in the stock of debt levels has been matched by a rise in total household wealth in Australia. Thanks to a surge in the value of houses and a rise in financial wealth, we are far richer. Wealth rose 9.5% last year to a new record. The value of average household wealth has gone from five times average annual after tax household income in 1990 to 9.5 times today. 

Source: ABS, RBA, AMP Capital  

So, while the average level of household debt for each man, woman and child in Australia has increased from $11,837 in 1990 to $93,943 now, this has been swamped by an increase in average wealth per person from $86,376 to $475,569.   

Source: ABS, RBA, AMP Capital  

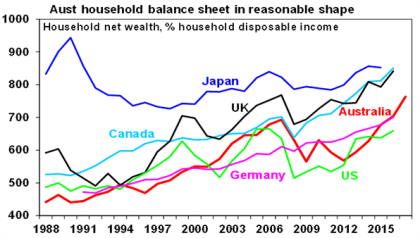
As a result, Australians’ household balance sheets, as measured by net wealth (assets less debt), are healthy. Despite a fall in net wealth relative to income through and after the GFC as shares and home prices fell, net wealth has increased substantially over the last 30 years and is in the middle of the pack relative to comparable countries.

Source: OECD, ABS, RBA, AMP Capital  

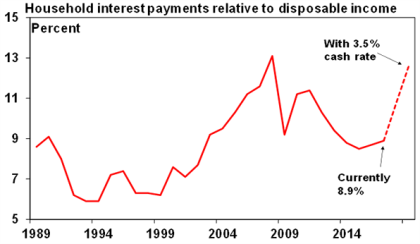
  • Fourthly, Australians are not having major problems servicing their loans. According to the Reserve Bank’s Financial Stability Review non-performing loans are low and Census and Household Expenditure Survey data shows that mortgage stress has been falling. Of course, this may reflect low mortgage rates with interest costs as a share of income running a third below its 2008 high. 


Source: RBA, AMP Capital  

  • Fifthly, debt is concentrated in higher income households who have a higher capacity to service it. This is particularly the case for investment property loans.

  • Sixthly, a disproportionate share of the rise in housing debt over the last 20 years owes to investment property loans. As servicing investment loans is helped by tax breaks the debt burden is not even as onerous.

  • Finally, lending standards have not deteriorated to the same degree in Australia as they did in the US prior to the GFC where loans were given to NINJAs – borrowers with no income, no job and no assets.

So what are the risks?

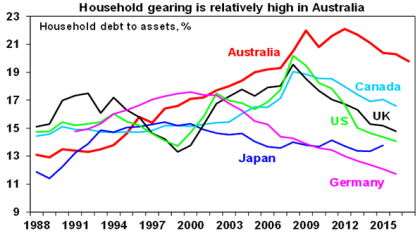
None of this is to say the rise in household debt is without risk. Not only has household debt relative to income in Australia risen to the top end of comparable countries but so too has the level gearing (ie the ratio of debt to wealth or assets).   

Source: OECD, RBA, AMP Capital

It certainly increases households’ vulnerability to changing economic conditions. There are several threats:  

  1. Higher interest rates – the rise in debt means moves in interest rates are three times as potent compared to say 25 years ago. Just a 2% rise in interest rates will take interest payments as a share of household income back to where they were just prior to the GFC (and which led to a fall in consumer spending). However, the RBA is well aware of the rise in sensitivities flowing from higher debt and so knows that when the time comes to eventually start raising rates (maybe later this year) it simply won’t have to raise rates anywhere near as much as in the past to have a given impact in say controlling spending and inflation. And so, it’s likely to be very cautious in raising rates (and is very unlikely to need to raise rates by anything like 2%.)

  2. Rising unemployment – high debt levels add to the risk that if the economy falls into recession, rising unemployment will create debt-servicing problems. However, it is hard to see unemployment rising sharply anytime soon.

  3. Deflation – high debt levels could become a problem if the global and local economies slip into deflation. Falling prices increase the real value of debt, which could cause debtors to cut back spending and sell assets, risking a vicious spiral.  However, the risk of deflation has been receding. 

  4. A sharp collapse in home prices – by undermining the collateral for much household debt – could cause severe damage. Fortunately, it is hard to see the trigger for a major collapse in house prices, ie, much higher interest rates or unemployment. And full recourse loans provide a disincentive to just walk away from the home and mortgage unlike in parts of the US during the GFC.

  5. A change in attitudes against debt – households could take fright at their high debt levels (maybe after a bout of weakness in home prices or when rates start to rise) and seek to cut them by cutting their spending. Of course, if lots of people do this at same time it will just result in slower economic growth. At present the risk is low but its worth keeping an eye on with Sydney and Melbourne property prices now falling. But high household debt levels are likely to be a constraint on consumer spending.

Conclusion

While the surge in household debt has left Australian households vulnerable to anything which threatens their ability to service their debts or significantly undermines the value of houses, the trigger for major problems remains hard to see. However, household discomfort at their high debt levels poses a degree of uncertainty over the outlook for consumer spending should households decide to reduce their debt levels.  

Source: AMP Capital 15 February 2018

Important note:

While every care has been taken in the preparation of this article, AMP Capital Investors Limited (ABN 59 001 777 591, AFSL 232497) and AMP Capital Funds Management Limited (ABN 15 159 557 721, AFSL 426455) makes no representations or warranties as to the accuracy or completeness of any statement in it including, without limitation, any forecasts. Past performance is not a reliable indicator of future performance. This article has been prepared for the purpose of providing general information, without taking account of any particular investor’s objectives, financial situation or needs. An investor should, before making any investment decisions, consider the appropriateness of the information in this article, and seek professional advice, having regard to the investor’s objectives, financial situation and needs. This article is solely for the use of the party to whom it is provided.

“High house-hold debt is Australia’s Achilles heel,” says AMP Capital Head of Investment Strategy and Economics and Chief Economist, Shane Oliver. “I’ve been thinking this for many years now and yet it seems to keep going higher.”

Latest data from the Australian Bureau of Statistics puts total household liabilities at $2.466 trillion, or 199.7 percent of disposable income, putting it among the highest in the world.

Australians have been borrowing money to keep apace of record high property prices in markets such as Sydney, which has enjoyed several years of double-digit percent price gains, and Melbourne. 

“We’ve seen roughly a four-fold increase in the value of household debt relative to income over the past 30 years,” says Oliver. “That obviously leaves Australian households vulnerable if interest rates rise or unemployment goes up.”

https://vimeo.com/254236075?color=0075ac&title=0&byline=0&portrait=0

While AMP Capital does expect the Reserve Bank of Australia to raise rates from their historic lows later this year, Oliver does not believe it will be enough to cause already easing property prices in Sydney and Melbourne to slump.

“I don’t see the Reserve Bank jacking interest rates up dramatically – I don’t see them doing that. The Reserve Bank knows household debt is high.”

The markets are predicting the RBA will raise the official cash rate off the record low 1.5 per cent level in late 2018. AMP Capital doesn’t believe this will happen before November. 

“The bottom-line is in the absence of much higher interest rates or much higher unemployment – both of which seem unlikely, it’s hard to see a crash in the Australian property market, but it’s certainly an issue worth keeping an eye on, given the high level of household debt,” Oliver says.

If households did have trouble servicing debts, they could be forced to sell their homes, causing price declines of 20 percent or more, but Oliver stresses that he does not see this as a likelihood in the absence of much higher rates or unemployment. 

Adding to his argument is the prospect that unemployment will fall rather that rise significantly. 

“It’s still too high, but I think over time as the global economy tends to improve, I think unemployment will go down rather than up.”

Australia’s unemployment rate rose to 5.5 per cent in December, from 5.4 per cent in November according to the Australian Bureau of Statistics, however on a positive note, the data also revealed employment rose every month in the 2017 calendar year, for the first time in at least forty years.


Source: AMP Capital 14 Feb 2018

Important note: While every care has been taken in the preparation of this article, AMP Capital Investors Limited (ABN 59 001 777 591, AFSL 232497) and AMP Capital Funds Management Limited (ABN 15 159 557 721, AFSL 426455) makes no representations or warranties as to the accuracy or completeness of any statement in it including, without limitation, any forecasts. Past performance is not a reliable indicator of future performance. This article has been prepared for the purpose of providing general information, without taking account of any particular investor’s objectives, financial situation or needs. An investor should, before making any investment decisions, consider the appropriateness of the information in this article, and seek professional advice, having regard to the investor’s objectives, financial situation and needs. This article is solely for the use of the party to whom it is provided.

“The only thing we have to fear is fear itself,” said Franklin D Roosevelt at his inauguration as US President in 1933.

I think “the only thing we have to fear is the fear index itself” is a better description of where investors are at right now. 

It’s been a wild ride on Wall Street and beyond of the past week – the worst in two years for the S&P 500 – with the volatility causing many to ask if the bubble has burst and the equities bull market is over. 

Instead, I believe the unusually sharp burst of volatility is largely the result of products and asset allocation strategies linked to the VIX, the so-called “fear index”, rather than any major re-assessment of the fundamental outlook.
 
To be sure, investors are right to be more worried than before about inflationary pressures arising from improved global economic conditions, the associated upward revision on the future path of interest rates and how that in turn impacts the valuation of share markets. 

However, I would suggest that these expectations haven’t changed anywhere near as rapidly as market prices. Investment products linked to the VIX appear to have amplified the recent market adjustment. 

And those that are not, such as fixed income and currency markets, experienced much more orderly changes. 

The VIX measures the stock market’s expectation of volatility implied by the price of option contracts on the S&P 500 index. Options enable investors to insure against large moves in the share market.  When investor uncertainty rises, the share market becomes more volatile, the price of insurance through option contracts increases, and so the VIX index rises. The VIX index spikes at times of markets crisis. Hence the “fear index” moniker.

Initially the VIX was simply designed to provide a measure of expectations of volatility for the US share market. However, over time many derivative instruments and exchange traded products were developed that allowed investors to bet on the performance of volatility itself. 

This has introduced the possibility of a destabilising feedback loop because there is often a requirement for these funds to quickly sell market exposure in response to a rise in volatility. This action can, in turn, push VIX even higher. That appears to have been the case this past week.

The following chart displays the VIX index over the past five years:

VIX (CBOE Market Volatility Index)

click to enlarge
VIX (CBOE Market Volatility Index)

Source: CBOE

The growth in popularity of these volatility-linked products has been due to their strong track record in a world where investors are searching for high income with low risk. 

The provision of insurance can be a profitable venture, especially if there is a strong demand and high insurance premiums as was the case for financial insurance in the aftermath of the Global Financial Crisis. And with investors believing that central banks were deliberately trying to suppress volatility, the VIX index was pushed down to historical lows, boosting the performance of these products.
 
However, more recently, given the growth in the supply of this insurance and the much-reduced premiums for its provision, these products were priced for disappointment and were susceptible to any surprise that pushed VIX higher.
 
A modest improvement reported last week on the outlook for wages and its impact on interest rate expectations produced an increase in fundamental share market risk. This appears to have triggered a risk cascade producing catastrophic losses in these products and several have been closed by their sponsors.

That probably doesn’t quite represent the end of this episode because it is widely known that there is also a large amount of institutional money whose asset allocation depends on the level of equity volatility. These strategies tend to target an overall level of realised portfolio volatility so they systematically sell equities when volatility increases and buy when volatility decreases. 

Given the extremely low level of volatility prevailing at the start on the year, these strategies will currently be at the top end of their permitted range of equity exposure. I’d expect their portfolio managers will quite likely be required to sell some equities in the weeks ahead because volatility is unlikely to fall back to very low levels any time soon.
 
Given that, many other investors may sit back waiting for evidence that these trades have cleared the market before they step back into their own discretionary strategies.
         
A few years ago, we did experience a few spikes in the VIX index related to uncertainty about economic developments in China. These episodes were short lived and market volatility quickly retraced to very low levels because investors were convinced central banks would continue to protect asset prices.
 
The difference now is that economic conditions have improved, and unconventional monetary policy is beginning to be withdrawn. So central banks may have a higher tolerance for some asset market volatility. In the language of the option markets “the strike price for the central bank put is now further out of the money”. 
   
Does any of this alter our assessment of the market outlook? Not really. We have, for some time, been anticipating a moderate increase in volatility as monetary policy shifts to a less accommodative phase.
 
Importantly, I don’t interpret the recent developments as the market signalling a rise in the likelihood of an economic recession over the next 18 months, even if there is a modest tightening of credit conditions. Nor do I believe that many businesses will alter their investment plans in light of this bout of extreme market volatility. 

In a few months’ time, I expect that the debate in markets will again focus on critical fundamental issues – the outlook for growth and inflation, the trajectory of cash rates, asset market valuations, as well as any unfolding geo-political developments.


Source: AMP Capital 14 Feb 2018

Important note: While every care has been taken in the preparation of this article, AMP Capital Investors Limited (ABN 59 001 777 591, AFSL 232497) and AMP Capital Funds Management Limited (ABN 15 159 557 721, AFSL 426455) makes no representations or warranties as to the accuracy or completeness of any statement in it including, without limitation, any forecasts. Past performance is not a reliable indicator of future performance. This article has been prepared for the purpose of providing general information, without taking account of any particular investor’s objectives, financial situation or needs. An investor should, before making any investment decisions, consider the appropriateness of the information in this article, and seek professional advice, having regard to the investor’s objectives, financial situation and needs. This article is solely for the use of the party to whom it is provided.

How did we find ourselves here? 

It’s a question I ask myself whenever I come across an article or when I’m drawn into a discussion comparing index fund returns with the after-tax returns of active fund managers. And I’m asking it a lot lately. 

As head of AMP Capital’s Multi Asset Group, the debate is usually misdirected by the time it gets to me, considering the multi-asset management process picks from different styles and strategies – including low-cost index strategies where it makes sense – to come up with a blended approach designed to meet an outcome for investors.

If anything, I’m an advocate for investing in index funds in the right place and at the right time when it is appropriate for the investor’s goals. At the end of the day, our returns are judged after fees and it’s in our interests to keep costs down as it is for any investor, financial adviser or superannuation fund trustee as long as you’re getting the right outcome.

However, as someone who works within a traditional active funds management business, I find myself addressing some of the inconsistencies in this well-worn “for and against” active versus passive argument, and invariably I’m left frustrated by where the debate ends up.

The wrong argument

The root of most of my frustration wading into this debate stems from my belief we’re having the wrong argument. 

What clients really need from asset managers is to help them deliver on their financial goals. Financial goals, in my experience, are absolute and relate to growth in capital to fund retirement; they’re about delivering a level of income every year or over whatever the period may be with confidence. As investment managers, we need to be able to deliver this with certainty and with limited surprises along the way. 

Rather than focus on goals, the industry has instead taken on this benchmark-aware mindset, mainly because it’s an easy way to compare ourselves to our peers. 

The funds management industry, in my view, has gone so far down this benchmark-aware path we’ve not only convinced ourselves but also our clients that we’re only doing a great job if we’re beating the benchmark. We’ve created this narrative at the expense of explaining what really matters to clients, which is their goals.

I absolutely get why there’s a bifurcation happening in the market right now where clients are moving away from that middle ground I’d describe as ‘core benchmark-aware products’ where they have been paying a decent management fee in return for something that’s essentially the benchmark. It’s not great value for them. 

Investors are rightfully moving away from these products into either very low-cost products or, at the other end of the scale, cost-effective but much more differentiated products where they also get value from their (typically higher) management fees. 

At AMP Capital, we’re doing the same thing as evidenced by the recent changes in our Australian Equities business. In October, we announced a repositioning of the business to focus on areas where there is long-term demand and where AMP Capital will deliver active and cost-effective capabilities that match client needs. 

As much as anyone, I understand the importance of reducing costs. Our aim as an industry should be to deliver great outcomes after costs. 

Lacking trust

The problem facing the funds management industry is one of trust. As we stand here today, active fund managers are not always trusted to deliver performance because of the sins of the past where some managers dressed up essentially index funds as actively managed funds and charged 100 basis points or more in fees for the privilege.  

At this point in time, the only thing clients can put their hands on and trust is cost. It’s the only tangible thing they have.
 
In reality, however, there are far more opportunities to deliver great outcomes for clients beyond focusing on cost alone. If we design great products to meet client goals and get the alpha component of the funds management process right, we can deliver much more beyond the savings investors are seeking by shunning active management and marching into passive funds. 

More than a few things have gone right for the index funds’ narrative, which has fuelled investor demand for low-cost passive funds at a time I believe investors need active management..  

What a time it’s been to own the benchmark while share markets have been driven by the actions of central banks globally printing money and leaving interest rate setting at their most accommodative. Correlations between shares and sectors have been unusually high as the market’s momentum has trumped anything earnings related.

Now, with inflation back on the horizon, and with many tipping four rate hikes this year from the US Federal Reserve, there has never been a more important time for investors to be thinking about what outcome they are investing for and which managers are best placed to deliver, rather than which benchmark they’re tracking.

I love a thoughtful discussion about the role both active and passive strategies play within a portfolio to help clients meet a desired outcome, but when the debate ends up pitting active fund performance against the benchmark I again ask myself how did we get here? And how can we change the debate so that we talk about what’s really important for clients?


Source: AMP Capital 14 Feb 2018

Author: Sean Henaghan

Sean Henaghan is the Director and CIO of AMP Capital’s Multi-Asset Group with responsibility for over $70 billion (as at June 2014) invested in AMP Capital’s multi-asset portfolios, multi-manager single sector portfolios and Tailored Investment Solutions. Mr Henaghan is a member of the AMP Capital Global Leadership Team and also sits on the AMP Capital Investment Committee.


Important note: While every care has been taken in the preparation of this article, AMP Capital Investors Limited (ABN 59 001 777 591, AFSL 232497) and AMP Capital Funds Management Limited (ABN 15 159 557 721, AFSL 426455) makes no representations or warranties as to the accuracy or completeness of any statement in it including, without limitation, any forecasts. Past performance is not a reliable indicator of future performance. This article has been prepared for the purpose of providing general information, without taking account of any particular investor’s objectives, financial situation or needs. An investor should, before making any investment decisions, consider the appropriateness of the information in this article, and seek professional advice, having regard to the investor’s objectives, financial situation and needs. This article is solely for the use of the party to whom it is provided.

The sudden market realisation that US borrowing costs are likely to rise significantly this year will drive demand for real estate investments that offer income growth, according to AMP Capital Head of Real Estate Research Luke Dixon.

The US stock market endured its biggest plunge in six years earlier this week, triggering ongoing volatility across the globe, as investors started to factor in the chance of three or more US Federal Reserve rate hikes this year.
 
The Fed raised rates three times last year and AMP Capital predicts it could raise rates as many as five times this year.

“These global factors will have a significant impact on real estate markets in Australia,” says Dixon. “Investors are going to be really focused on lifting the productivity and income performance of their assets as capital values slow in the face of higher capital costs.”

One sector where growth in demand is likely to outpace cost of capital increases is industrial, which will benefit from a structural shift towards online retail spending.

“Our view is that in Australia the industrial sector is best placed to take advantage of the global and structural changes occurring in our economy,” says Dixon. “It has capacity for higher income growth moving forward, higher liquidity of stock and lower total entry costs relative to other asset classes such as office and retail.”

https://vimeo.com/255302454?color=0075ac&title=0&byline=0&portrait=0

Ecommerce giant Amazon launched in Australia late last year and, along with local rivals, is expected to lift fulfillment capabilities to deliver better, faster delivery options.

“The industrial sector has a particularly strong narrative around ecommerce growth going forward,” Dixon says. “Our view is that the arrival of Amazon in Australia will be a strong catalyst for industrial space demand. We are forecasting over 500,000sqm of gross take up from ecommerce providers over the next five years.” 

“That is going to lead to an upswing in demand for industrial nationally, particularly in markets like Sydney and Melbourne that have high population density and high population growth,” says Dixon. “They will benefit from rental growth based off this demand.”

Technology-related manufacturing will be another growth spot in the industrial sector, he predicts. 

“We believe areas such as solar panel manufacturers and specialised technology manufacturers are going to be growth sectors that will propel rents higher than the long-term average of four per cent across most major industrial markets,” Dixon says.

Whilst capital costs will increase, income levels are lifting as the Australian economy enters its 27th year of continuous economic growth. The broadening of this growth as Queensland enters a more sustained economic recovery, points to sustained demand momentum for all commercial asset classes in 2018. 
Even before this week’s equity market turmoil, interest rates in the US, Canada and UK had already lifted bond rates, and global growth projects to a record high of 3.8% according to the IMF in 2018. 

This indicates that we are in the early stages of a global transition from the ‘lower for longer’ theme of the past five years, to a higher cost of capital environment moving forward. 

It’s not all good news in the property sector though. The very forces that are helping drive demand in the industrial space for logistics centres, is likely to put pressure on many customer-facing retail stores.

“There are some headwinds,” says Dixon. Ecommerce will undoubtedly deliver benefits for industrial  demand, however the structural shift towards online will negatively impact sales growth in the retail sector going forward.”

To adapt to the escalating rise of online retail, he predicts good shopping centre owners will be investing heavily in upgrading spaces to include more interactive experiences such as dining and entertainment, in order to generate income growth. 

“As we move into a higher cost-of-funding environment, investors will be targeting assets best placed to produce strong income growth through the cycle.” Dixon says. “That means attracting the best tenants in the fastest growing markets to guarantee that income during potentially a weaker economic growth period.”

AMP Capital expects the Reserve Bank to raise the official cash rate from the record low of 1.5 per cent in late 2018 or early 2019. Increased borrowing costs tend to lead to a depreciation in real estate values, however this has been a lowly geared real estate cycle relative to past cycles, which points to pricing deterioration being minimal, and dependent upon the severity and number of future rate increases.


Source: AMP Capital 14 Feb 2018

Important note: While every care has been taken in the preparation of this article, AMP Capital Investors Limited (ABN 59 001 777 591, AFSL 232497) and AMP Capital Funds Management Limited (ABN 15 159 557 721, AFSL 426455) makes no representations or warranties as to the accuracy or completeness of any statement in it including, without limitation, any forecasts. Past performance is not a reliable indicator of future performance. This article has been prepared for the purpose of providing general information, without taking account of any particular investor’s objectives, financial situation or needs. An investor should, before making any investment decisions, consider the appropriateness of the information in this article, and seek professional advice, having regard to the investor’s objectives, financial situation and needs. This article is solely for the use of the party to whom it is provided.

With Valentine’s Day around the corner, it’s a good time to explore shared ideas, and how you manage money as a twosome.

Our approach to managing household finances can make a big difference to the health of a relationship. Thankfully, the old line about “I earn the money. She spends it” no longer has relevance in modern relationships. Today’s lifestyles, housing commitments and our career ambitions mean that in many households both adults work, each making a valuable contribution to overall income.

Yet the question of who controls the purse strings continues to throw up some interesting responses. I’ve come across all sorts of research on this issue, and the general gist is that the majority of men say they make the financial decisions in a household while the majority of women believe they control the money. Confusing, right?

Harness the power of two

The thing is, the real issue shouldn’t be who controls the cash but rather how you manage your finances as a couple.

This is an area where I see plenty of variations, and there’s no right or wrong approach. Some couples like to maintain almost entirely separate financial lives by only pooling money where necessary to pay the mortgage or rent and other shared bills.

Others maintain a joint account, pooling most or part of each individual pay packet to cover household expenses, and holding only a limited quantity of cash in individual accounts to cover personal spending like hobbies or treats.

Exactly how you run your system is entirely a matter of choice, and it is a case of determining what works best for you and your partner.

Maintaining multiple bank accounts can mean paying more in bank fees, though this can be a small price to pay if it gives you both a degree of financial independence – this in itself can be a relationship saver.

Know what works for you

There is virtually no limit to the options available to divide and share a household’s combined income and expenses. What matters is that you take the time to devise a system that works for you. Be prepared to fine-tune your approach, or scrap it altogether, if it isn’t living up to expectations. The whole point of the exercise is to work as a team.

At the very least, both parties to a couple should know where household money is being spent. Having a clear idea of your combined financial position could stand you in good stead – and help you avoid unpleasant surprises if the relationship ever hits the rocks.

In my experience though, working together to achieve shared financial goals can really strengthen a relationship over time.

For a tailored plan of action that can help you and your spouse or partner achieve financial harmony – and harness the power of two , please contact us on Phone: 07 5641 4134 for assistance .

Source : AMP 2 February 2018 

Paul Clitheroe is a founding director of financial planning firm ipac, Chairman of the Australian Government Financial Literacy Board and chief commentator for Money Magazine.
 
This article provides general information and hasn’t taken your circumstances into account. It’s important to consider your particular circumstances before deciding what’s right for you. Although the information is from sources considered reliable, we do not guarantee that it is accurate or complete. You should not rely upon it and should seek qualified advice before making any investment decision. Except where liability under any statute cannot be excluded, we do not accept any liability (whether under contract, tort or otherwise) for any resulting loss or damage of the reader or any other person..


The pullback in shares seen over the last week or two has seen much coverage and generated much concern. This is understandable given the rapid falls in share markets seen on some days. From their highs to their recent lows, US and Japanese shares have fallen 10%, Eurozone shares have fallen 8%, Chinese shares have fallen 9% and Australian shares have lost 6%. This note looks at the issues for investors and puts the falls into context.

Drivers behind the plunge

There are basically three drivers behind the plunge in share prices. First, the trigger was worries that US inflation would rise faster than expected resulting in more aggressive rate hikes by the US Federal Reserve and higher bond yields. Flowing from this are worries that the Fed might get it wrong and tighten too much causing an economic downturn and that higher bond yields will reduce the relative attractiveness of shares and investments that have benefitted from the long period of low interest rates.

Second, after not having had a decent correction since before Donald Trump was elected president and with high and rising levels of investor confidence, the US share market was long overdue a correction, which had left the market vulnerable.

Finally, and related to this, the speed of the pull back is being exaggerated by the unwinding of a large build up of so-called short volatility bets (ie bets that volatility would continue to fall) via exchange traded investment products that made such bets possible. The unwinding of such positions after volatility rose further pushed up volatility indexes like the so-called VIX index and that accelerated the fall in US share prices. Quite why some investors thought volatility would continue to fall when it was already at record lows beats me, but this looks to be another case of financial engineering gone wrong!

With shares having had a roughly 5-10% decline (in fact US share futures had had a 12% fall) from their recent highs to their lows and oversold technically and with the VIX volatility index having spiked to levels usually associated with market bottoms, we may have seen the worst but as always with market pull backs it’s impossible to know for sure particularly with bond yields likely to move still higher over time and if there is further unwinding of short volatility positions to go.

Considerations for investors

Sharp market falls with talk of billions of dollars being wiped off shares are stressful for investors as no one likes to see the value of their investments decline. However, several things are worth bearing in mind:

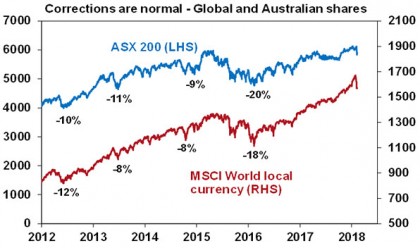
First, periodic corrections in share markets of the order of 5-15% are healthy and normal. For example, during the tech com boom from 1995 to early 2000, the US share market had seven pull backs greater than 5% ranging from 6% up to 19% with an average decline of 10%. During the same period, the Australian share market had eight pullbacks ranging from 5% to 16% with an average of 8%. All against a backdrop of strong returns every year. During the 2003 to 2007 bull market, the Australian share market had five 5% plus corrections ranging from 7% to 12%, again with strong positive returns every year. More recently, the Australian share market had a 10% pullback in 2012, an 11% fall in 2013 (remember the taper tantrum?), an 8% fall in 2014 and a 20% fall between April 2015 and February 2016 all in the context of a gradual rising trend. And it has been similar for global shares, but against a strongly rising trend. See the next chart. In fact, share market corrections are healthy because they help limit a build up in complacency and excessive risk taking.


Source: Bloomberg, AMP Capital

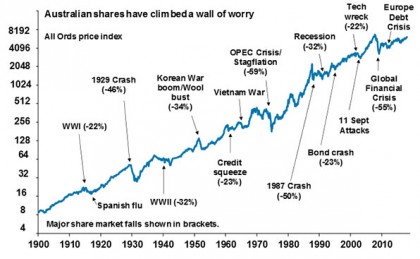
Related to this, shares literally climb a wall of worry over many years with numerous events dragging them down periodically, but with the long-term trend ultimately rising and providing higher returns than other more stable assets. In fact, bouts of volatility are the price we pay for the higher longer-term returns from shares.


Source: ASX, AMP Capital

Second, the main driver of whether we see a correction (a fall 5% to 15%) or even a mild bear market (with say a 20% decline that turns around relatively quickly like we saw in 2015-2016) as opposed to a major bear market (like that seen in the global financial crisis (GFC)) is whether we see a recession or not. Our assessment remains that recession is not imminent:

  • The post-GFC hangover has only just faded with high levels of business and consumer confidence globally only just starting to help drive stronger consumer spending and business investment.

  • While US monetary conditions are tightening they are still easy, and they are still very easy globally and in Australia (with monetary tightening still a fair way off in Europe, Japan and Australia). We are a long way from the sort of monetary tightening that leads into recession.

  • Tax cuts and their associated fiscal stimulus will boost US growth in part offsetting Fed rate hikes.

  • We have not seen the excesses – in terms of debt growth, overinvestment, capacity constraints and inflation – that normally precede recessions in the US, globally or Australia.

Reflecting this, global earnings growth is likely to remain strong providing strong underlying support for shares.

Third, selling shares or switching to a more conservative investment strategy or superannuation option after a major fall just locks in a loss. With all the talk of billions being wiped off the share market, it may be tempting to sell. But this just turns a paper loss into a real loss with no hope of recovering. The best way to guard against making a decision to sell on the basis of emotion after a sharp fall in markets is to adopt a well thought out, long-term investment strategy and stick to it.

Fourth, when shares and growth assets fall they are cheaper and offer higher long-term return prospects. So the key is to look for opportunities that the pullback provides – shares are cheaper. It’s impossible to time the bottom but one way to do it is to average in over time.

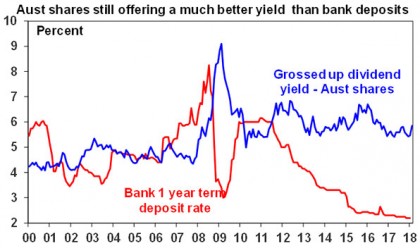
Fifth, while shares may have fallen in value the dividends from the market haven’t. So the income flow you are receiving from a well-diversified portfolio of shares continues to remain attractive, particularly against bank deposits.


Source: RBA, Bloomberg, AMP Capital

Sixth, shares and other related assets often bottom at the point of maximum bearishness, ie just when you and everyone else feel most negative towards them. So the trick is to buck the crowd. As Warren Buffett once said: “I will tell you how to become rich…Be fearful when others are greedy. Be greedy when others are fearful.”

Finally, turn down the noise. At times like the present, the flow of negative news reaches fever pitch – and this is being accentuated by the growth of social media. Talk of billions wiped off share markets, record point declines for the Dow Jones index and talk of “crashes” help sell copy and generate clicks and views. But such headlines are often just a distortion. We are never told of the billions that market rebounds and the rising long-term trend in share prices adds to the share market. And as share indices rise in level over time of course given size percentage pullbacks will result in bigger declines in terms of index points. And 4% or so market falls are hardly a “crash”. Moreover, they provide no perspective and only add to the sense of panic. All of this makes it harder to stick to an appropriate long-term strategy let alone see the opportunities that are thrown up. So best to turn down the noise and watch Brady Bunch, 90210 or Gilmore Girls re-runs!


Source: AMP Capital 09 February 2018

Important note: While every care has been taken in the preparation of this article, AMP Capital Investors Limited (ABN 59 001 777 591, AFSL 232497) and AMP Capital Funds Management Limited (ABN 15 159 557 721, AFSL 426455) makes no representations or warranties as to the accuracy or completeness of any statement in it including, without limitation, any forecasts. Past performance is not a reliable indicator of future performance. This article has been prepared for the purpose of providing general information, without taking account of any particular investor’s objectives, financial situation or needs. An investor should, before making any investment decisions, consider the appropriateness of the information in this article, and seek professional advice, having regard to the investor’s objectives, financial situation and needs. This article is solely for the use of the party to whom it is provided.

With no definitive retirement age in Australia, the date you exit the workforce will probably come down to personal circumstances and whether you can afford it.

The age you retire in Australia isn’t set in stone. You can really retire whenever you want to, but health, financial commitments and your ability to fund the lifestyle you want will play a big part.

For this reason, you may want to consider the age you’ll be able to access your super and the government’s Age Pension (if you’re eligible for it), which typically won’t be at the same time.

If it’s something you’ve been thinking about, here’s some other related information.

What age are Australians retiring? 

The average age at retirement for persons aged 45 years and over in Australia, according to 2016–17 statistics, is 55.3 years—58.8 years for men and 52.3 years for women1.

Figures released last year also revealed that more Australians were retiring later in life in comparison to years gone by and retirement was not necessarily a one-time event, with 26.7% of those in the 45 to 54 and 55 to 59 age groups returning to employment annually2.

When can I access my super? 

Generally you can access your super when you:

  • reach preservation age and you retire

  • cease an employment arrangement after age 60

  • reach preservation age and implement a transition to retirement strategy

  • turn 65, whether you remain in the workforce or not.

What is my preservation age?

Your preservation age is when you can start to access your super. It will be between 55 and 60 depending on when you were born.

Check out the table below to see what your preservation age is3.

Date of birth

Preservation age

Before 1 July 1960 

55

1 July 1960 – 30 June 1961

56

1 July 1961 – 30 June 1962

57

1 July 1962 – 30 June 1963

58

1 July 1963 – 30 June 1964

59

From 1 July 1964

60

How can I take my super? 

If you’re wondering what you might do with your super money when you do access it, remember there will be a number of things to weigh up and look into.

Taking super as a lump sum 

A lump sum could help you pay off your home loan or other outstanding debts, but there may be tax implications to consider and you should think about what you’ll live on if you have no super left.

The government’s Age Pension could be one option, although if you’re pinning your hopes entirely on government support, you should consider the sort of lifestyle it might fund.

June 2017 figures show a 65-year-old retiring today needs an annual income of $43,695 to fund a ‘comfortable’ lifestyle in retirement, assuming they are relatively healthy and own their home outright4. By comparison, the max Age Pension rate for a single person is around $23,254 annually5.

For more information, check out our article – Should I take my super as a lump sum.

Moving it into an account-based pension (or allocated pension)

If you’re thinking that you’d like to receive a regular income in retirement, an account-based pension (or allocated pension) could be a tax-effective option.

While the most you’ll be able to transfer into these pension accounts is $1.6 million, you won’t be limited to what you can take out. However, each year you’ll need to withdraw a minimum amount.

For more information, check out our article – Making sense of account-based pensions.

Purchasing an annuity with your super 

An annuity provides a series of regular payments over a set number of years, or for the remainder of your life, depending on whether you opt for a fixed-term or lifetime annuity.

You will however be sacrificing some flexibility, as you can’t easily make lump sum withdrawals and life expectancy is also a major consideration.

For more information, including the pros and cons, read our article – What’s an annuity?

What about the Age Pension? 

Currently, to be eligible for a full or part Age Pension from the government, you must be 65 or older and satisfy an income test and an assets test, as well as other requirements6.

In July, the qualifying age for the Age Pension increased to 65 and 6 months, and it will continue to increase by six months every two years until 1 July 2023 when the qualifying age will be 67.

You can check out your Age Pension eligibility age below7.

Date of birth

Age Pension eligibility age

Before 1 July 1952

65 years

1 July 1952 – 31 December 1953

65 years and 6 months

1 January 1954 – 30 June 1955

66 years

1 July 1955 – 31 December 1956

66 years and 6 months

From 1 January 1957

67 years

Meanwhile, it’s important to remember that what you do, and at what time you do it, could have tax implications and may impact your social security entitlements. This is why it’s important you do your research and explore the alternatives with your financial adviser.

Can I return to work if I’ve taken my super?

Generally, you can, but if you previously declared your permanent retirement, you may need to prove your intention was genuine at the time.

According to retirees who did return to full or part-time employment, the most common reasons why they decided to go back to the workforce was financial necessity, followed closely by boredom8.

For more information, check out our article – Can I go back to work if I’ve taken my super?

To determine what will work best for you, it might be an idea to contact us on Phone: 07 5641 4134

Source : AMP 24 January 2018 

ABS – Retirement and Retirement Intentions, Australia, July 2016 to June 2017 paragraph 6
The Household, Income and Labour Dynamics in Australia (HILDA) Survey 2017 pages 65, 67
3, 4 The Australian Taxation Office – Accessing your super 
ASFA retirement standard – June 2017 quarter table 1
6, 7, 8 Department of Human Services – Age Pension – eligibility and payment rates 
ABS – Australian Social Trends – Older people and the labour market paragraph 26

This article provides general information and hasn’t taken your circumstances into account. It’s important to consider your particular circumstances before deciding what’s right for you. Although the information is from sources considered reliable, we do not guarantee that it is accurate or complete. You should not rely upon it and should seek qualified advice before making any investment decision. Except where liability under any statute cannot be excluded, we do not accept any liability (whether under contract, tort or otherwise) for any resulting loss or damage of the reader or any other person..

Some people may have made big money, but plenty of latecomers would have experienced dreadful losses.

If I could sum up the contents of my junk emails over the last 12 months in a single word it would be: Bitcoin. I can’t tell you how many unsolicited invitations I’ve received to start trading bitcoin. This alone is a concern but when heavy hitters like the International Monetary Fund (IMF) start calling out the risks of bitcoin, the warning bells should definitely start ringing.

Bitcoin is one of many “cryptocurrencies” or digital currencies that aren’t backed by governments or banks. Instead it relies on a decentralised peer-to-peer network called a blockchain – a vast digital ledger that uses complex calculations to record all transactions made using bitcoin.

The technical details are complex. What’s much easier to grasp is the meteoric rise of bitcoin.

Big gains means big risks

For many years you could buy bitcoin for the price of a restaurant meal. Then in 2016 it started to take off. By mid-December 2017 bitcoin had soared in value to $AUD25,410. And that’s where things headed south. In mid-January 2018 bitcoin’s value had tanked to $AUD12,893.

As so often happens in speculative markets, some people have made big money. But plenty of latecomers would have experienced dreadful losses.

Security concerns

Hindsight is always a wonderful thing. But one of the fundamental rules of investing is that big returns come with big risks. Another maxim for successful investing is to only invest in something you understand, and it’s a reasonable bet plenty of people don’t fully grasp how cryptocurrencies work.

The problem is, crooks do. A report by the University of Cambridge notes that 22% of bitcoin exchanges having experienced security breaches. The same report says less than half the cryptocurrency payment companies in the Asia-Pacific, Europe and Latin America hold a government license.

It’s hardly reassuring stuff. And just recently the IMF warned that cryptocurrencies can “post considerable risks as potential vehicles for money laundering, terrorist financing, tax evasion and fraud”.

Yet despite all this, investors are still pouring money in, hoping to ride a second wave of gains.

Is bitcoin a good investment?

History is littered with the fallout from speculative markets, and the pattern is often similar – a steep rise in value fueled by investors coming on board late in the cycle for fear of missing out. 

For my money, a good investment is backed by a quality asset – like shares in a successful company, a well-located investment property, or units in a managed fund run by a reputable team. There are plenty such investments to choose from, and your adviser can help narrow down the choice of what’s right for you.

As it stands, cryptocurrencies are largely unregulated, and without the backing of an underlying asset there is no real reason why their value should continue to rise other than demand from over-exuberant investors. If you do plan to invest in bitcoin, my advice is to only tip in money you can afford to lose.

 Please contact us on Phone: 07 5641 4134 if you seek further discussion or assistance .

Paul Clitheroe is a founding director of financial planning firm ipac, Chairman of the Australian Government Financial Literacy Board and chief commentator for Money Magazine.
Source : AMP 24 January 2018 


This article provides general information and hasn’t taken your circumstances into account. It’s important to consider your particular circumstances before deciding what’s right for you. Although the information is from sources considered reliable, we do not guarantee that it is accurate or complete. You should not rely upon it and should seek qualified advice before making any investment decision. Except where liability under any statute cannot be excluded, we do not accept any liability (whether under contract, tort or otherwise) for any resulting loss or damage of the reader or any other person..