Growth bounces back (again)

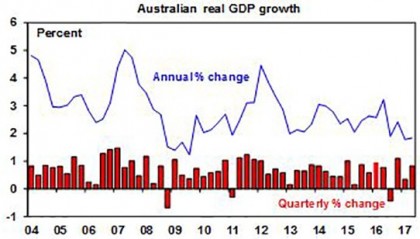
After another (weather related) soft patch in the March quarter, Australian economic growth bounced back in the June quarter with quarterly growth of 0.8%, up from 0.3%. However, annual growth is still subdued at 1.8% year on year, which is well below potential of around 2.75%. In the quarter, growth was helped by a pick-up in consumer spending and business investment, strong public investment and a contribution from net exports after a detraction in the March quarter.


Source:
ABS, AMP Capital

Australia continues to defy the doomsters’ endless recession calls. Against this, economic and underlying profit growth is lagging that seen in major economies. However, there are some positives pointing to a pick-up in growth.

Threats, risks and worries

Putting global threats aside, Australia’s worry list is well known:
 
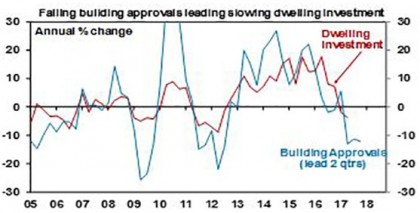
  • Housing construction is starting to slow with falling approvals pointing to a further slowing (see next chart).

Source:
ABS, AMP Capital

  • Related to this, there is the risk of a house price crash “as seen” on Four Corners. However, there have been endless property crash calls since around 2004. In the absence of a stronger supply surge, the Reserve Bank of Australia (RBA) making a mistake and raising rates too high and/or unemployment surging, our view is that a slowdown in Sydney and Melbourne is likely, but not a crash.

  • Consumer spending is constrained by record low wages growth and high levels of underemployment. While consumer spending has been running faster than income growth, as rising wealth has allowed consumers to run down household savings (to now just 4.6%) this is unlikely to continue as the wealth effects flowing from property price gains in Sydney and Melbourne slow. Rapid power cost increases and high debt are also not helping. All of which is driving low consumer confidence.

  • Mining investment is still falling with business investment intentions pointing to another 22% fall this financial year.

  • The Australian dollar is up 16% from last year’s low and at around $US0.80 (and threatening to go higher) it is at risk of slowing growth (and investment) in trade-exposed sectors like tourism, agriculture and manufacturing.  

  • Underlying inflation is too low and risks staying below target for longer due to record low wages growth, a rising $A, competitive pressures & weak rents as new supply hits.

  • Our political leaders seem collectively unable to undertake productivity-enhancing economic reforms and take decisive action (eg, on energy policy). With the citizenship crisis threatening an early election, it’s unlikely we will see an improvement any time soon.

Five reasons to expect growth to improve

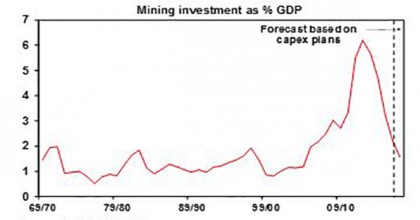
These worries are well known and despite them we remain of the view that recession will be avoided and growth will pick up over the year ahead: First, the growth drag from falling mining investment is nearly over. Mining investment peaked at nearly 7% of GDP four years ago and has since been falling at around 25% per annum (pa), knocking around 1.5% pa from GDP growth. At around 2% of GDP now, its weight in the economy has collapsed reducing its growth drag to around 0.4% this year and it’s near the bottom (see next chart). 

Source:
ABS, AMP Capital

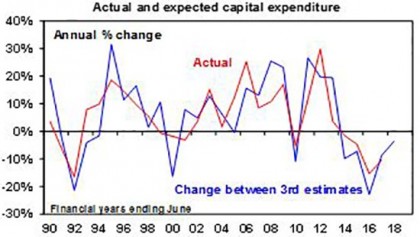
  • Second, non-mining investment is likely to rise this year. Comparing corporate investment plans for this financial year with those made a year ago points to a decline in business investment this year of around 3.5% (see next chart). But this is the best it’s been since 2013 and once mining investment is excluded this turns into an 8% gain for non-mining investment.

Source:
ABS, AMP Capital

  • Third, public investment is rising strongly, up 14.7% over the last year, reflecting state infrastructure spending.

  • Fourthly, net exports are likely to continue adding to growth as the completion of resources projects boosts mining and energy export volumes and services sectors like tourism and higher education remain strong.

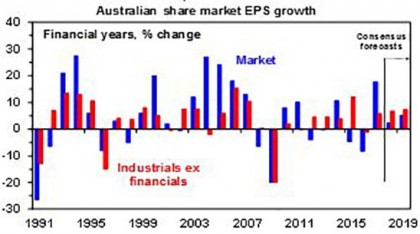
  • Finally, profits for listed companies are rising again after two years of falls. This is a positive for investment and the flow of dividends helps household incomes.

Source:
UBS, AMP Capital

These considerations should ensure that the Australian economy continues to avoid recession and that growth should pick up to around a 2.5% to 3% pace over the year ahead. This should be enough to head off further cuts in the cash rate. But with growth still a bit below RBA forecasts, wages growth likely to pick up only slowly, inflation likely to remain subdued abstracting from higher electricity prices, and the RBA likely wanting to avoid pushing the $A higher, our view remains that the RBA will keep the cash rate unchanged at 1.5% out to the December quarter 2018 at least before starting to raise rates.

Implications for investors

There are several implications for Australian based investors.

First, a return to reasonable growth is positive for growth assets. Australian shares are vulnerable to a short term US-led share market correction – given North Korean and Trump risks – but we remain of the view that it will be higher by year end.

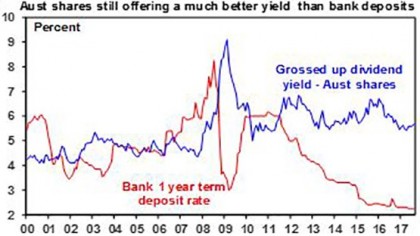
Second, bank deposits are likely to provide poor returns for investors for a while yet, highlighting the case for yield-focussed investors to continue to look for superior sources of yield. The yield gap between Australian shares and bank deposits remains wide, driving a strong source of demand for shares. After Telstra cut its dividend, just make sure you get a well-diversified portfolio of stocks paying decent dividends though.

Source:
RBA, AMP Capital

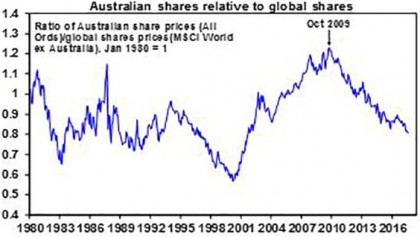
Third, while Australian shares are great for income, global shares are likely to remain outperformers for capital growth. In fact, global shares have been outperforming Australian shares since October 2009. This reflects relatively tighter monetary policy in Australia, the commodity slump, the lagged impact of the rise in the $A above parity in 2010, and a mean reversion of the 2000 to 2009 outperformance by Australian shares. And of course, abstracting from volatile resource company earnings, underlying profit growth at around 5-6% in Australia is well below that in the US (at around 11%) and Europe and Japan (at around 20-30%) so the underperformance of Australian shares may have a while to go yet. Which all argues for a continuing decent exposure to global shares relative to Australian shares.

Source: Thomson Reuters, AMP Capital


Source: AMP Capital 06 September 2017

About the Author
Dr Shane Oliver, Head of Investment Strategy and Economics and Chief Economist at AMP Capital is responsible for AMP Capital’s diversified investment funds. He also provides economic forecasts and analysis of key variables and issues affecting, or likely to affect, all asset markets.

Important note: While every care has been taken in the preparation of this article, AMP Capital Investors Limited (ABN 59 001 777 591, AFSL 232497) and AMP Capital Funds Management Limited (ABN 15 159 557 721, AFSL 426455) makes no representations or warranties as to the accuracy or completeness of any statement in it including, without limitation, any forecasts. Past performance is not a reliable indicator of future performance. This article has been prepared for the purpose of providing general information, without taking account of any particular investor’s objectives, financial situation or needs. An investor should, before making any investment decisions, consider the appropriateness of the information in this article, and seek professional advice, having regard to the investor’s objectives, financial situation and needs. This article is solely for the use of the party to whom it is provided.


Disruption was one of the buzz words in 2016 but the discussion largely focused on the potential of technology to disrupt established business models. In 2017, we expect technologies to deliver the first waves of impact. A few industries in particular will see technology change the way they do business, namely manufacturing, finance and retail.

Automated vehicles

Driverless cars have the potential to impact a number of industries in profound ways, all of which AMP Capital considers in detail in our long-term ESG research1. The technology is gathering pace. Some observers are now forecasting that a level four automated car (one level beneath full automation) capable of mass production will be tested in 2017. 

Entrepreneur Elon Musk has promised to have a Tesla drive itself from Los Angeles to New York City with no human input this year and it is possible that Waymo (formerly Google’s autonomous driving subsidiary) will launch a commercial level four service in some locations this year.

Waymo has also recently announced that it has developed technology that operates in rain, fog and snow while BMW said in January 2017 that it will test 40 self-driving cars in suburban environments in the second half of this year. These were previously considered to be key barriers to the technology. Volvo is lending 100 of its level four automated SUVs to Swedish customers to test it on commuter routes at average speeds of 70 kilometres per hour. 

Some governments are proactively courting driverless car technologies by offering areas as test sites and passing regulatory guidelines for the operation of driverless cars on public roads2. Real estate, retail, infrastructure and insurance are the four industries that are shaping up to be the most profoundly affected by these vehicles in the medium term.

Blockchain 

Blockchain has the potential to be one of the most transformative technologies for large businesses in decades. Blockchain is basically a shared distributed ledger, or a database of real-time transactions, that can be accessed by any node in the network at any time.

Blockchain allows for the exchange of data in real time for very little cost and is relatively safe and secure because the system operates across a network of computers. It is a peer-to-peer system so is considered safer and more transparent than its traditional brethren, which was managed by one central authority on the one internal platform. It is possible that 2017 will be the year that one of the large financial services organisations globally will announce that it is switching a significant IT platform to blockchain. 

The Australian Securities Exchange (ASX) has been the global leader to date in developing applications for its exchange; more specifically, its cash equities clearing and settlement operation. It ultimately hopes blockchain will replace CHESS, its system for recording shareholdings and managing the settlement of share transactions.

In January 2017, the largest settlements and clearing business in the US, the Depository Trust and Clearing Corp, announced that it will be switching one of its major data warehouses to blockchain technology from early 2018. Most of the focus has been on financial services to date but, just like driverless cars, it has been on potential rather than implementation.

Online retailing moving offline

At the end of 2016, Amazon announced that it is testing bricks and-mortar grocery stores in the US and that these stores will not have check outs. A mobile phone app keeps a record of the goods consumers pick up from the shelves, and then charges consumers through the app as they leave the store.

Amazon’s announcement was further evidence of the trend we are seeing in global listed real estate and retail: online is moving offline. The last few years have proved that online is not destroying bricks-and-mortar real estate. Rather, the two will co-exist and need each other to survive. 

Consumers expect to be able to choose whether to shop online or on foot, and bricks-and-mortar stores will morph into real-life embodiments of the brand to provide experiences that cannot be replicated online. This trend has far-reaching implications for investments in global listed real estate, with changes to supply and demand dynamics likely to impact property valuations.

For more information on ESG issues, please see our latest corporate governance report


Source: AMP Capital 16 June 2017

Author:  Kristen Le Mesurier, Senior ESG Analyst, Investment Research AMP Capital

1 The legal, regulatory and consumer barriers to driverless cars were covered in AMP Capital’s Corporate Governance Report in September 2016.
2 For example, the United States Department of Transportation released its Federal Automated Vehicles Policy in September 2016 titled Accelerating the Next Revolution in Roadway Safety.

While every care has been taken in the preparation of this document, AMP Capital Investors Limited (ABN 59 001 777 591, AFSL 232497) and AMP Capital Funds Management Limited (ABN 15 159 557 721, AFSL 426455) make no representations or warranties as to the accuracy or completeness of any statement in it including, without limitation, any forecasts. Past performance is not a reliable indicator of future performance. This document has been prepared for the purpose of providing general information, without taking account of any particular investor’s objectives, financial situation or needs. An investor should, before making any investment decisions, consider the appropriateness of the information in this document, and seek professional advice, having regard to the investor’s objectives, financial situation and needs. This document is solely for the use of the party to whom it is provided.


It seems almost an understatement to say that the self-managed super sector holds a lion’s share of superannuation’s retiree market in dollar terms.

The recently-published Superannuation Market Projections report by consultants Rice Warner calculates that SMSFs hold more than half of the assets invested in superannuation retirement products. No other superannuation sector comes anywhere close.

lion-wild-africa-african

This market share is explained in part by such factors as the higher average age of SMSF members and their much larger average balances. Another factor is that almost all SMSF members take their super as a pension upon retirement rather than a lump sum.

As a growing proportion of the population ages, builds-up their super wealth and enters retirement, industry super funds in particular are expected to increase their share of the retirement market.

Yet SMSFs are projected to keep holding by far the biggest share of the retirement market, again in dollar terms, for many years to come.

Rice Warner expects that the market share of retirement assets held by the various fund sectors to change over the next 15 years to: SMSFs, 44.2 per cent (52.5 per cent today); industry funds, 17.8 per cent (6.1 per cent today); commercial funds, 29.1 per cent (32.1 per cent today); public-sector funds, 8.9 per cent (8.4 per cent today); and corporate funds, nil per cent (0.9 per cent today).

Given that the SMSF sector has the largest share of retirement assets today, it will, of course, experience the biggest share of pension withdrawals.

Further, the new lower contribution caps from July 2017 will make it harder for members to establish very large SMSFs in the future, Rice Warner emphasises. In turn, this will have an impact on the SMSF share of assets in the pension phase.

Meanwhile, industry funds will take a markedly larger share of the retirement market – up from just 6 per cent today – as growing numbers of their members retire. Another factor at play is that industry funds keep improving the competitiveness of their pension products to retain members into retirement.

From an individual super member’s perspective, these market share stats are yet another reminder of the need to save and plan for a retirement that could be fast approaching for many of us – if it isn’t here already.

Perhaps you among those baby boomers who can clearly remember back to the days when their intended retirement date was sometime in the far, far distant future? Well, that future may be fast arriving.

Source:

Written by Robin Bowerman, Head of Market Strategy and Communications at Vanguard.

Reproduced with permission of Vanguard Investments Australia Ltd

Vanguard Investments Australia Ltd (ABN 72 072 881 086 / AFS Licence 227263) is the product issuer. We have not taken yours and your clients’ circumstances into account when preparing this material so it may not be applicable to the particular situation you are considering. You should consider your circumstances and our Product Disclosure Statement (PDS) or Prospectus before making any investment decision. You can access our PDS or Prospectus online or by calling us. This material was prepared in good faith and we accept no liability for any errors or omissions. Past performance is not an indication of future performance.

© 2017 Vanguard Investments Australia Ltd. All rights reserved.

Important:

Any information provided by the author detailed above is separate and external to our business and our Licensee. Neither our business, nor our Licensee take any responsibility for their action or any service they provide.

 I am regularly called on to provide forecasts for economic and investment variables like growth, interest rates, currencies and the share market. These usually come in the form of point forecasts as to where the variable that is being forecast will be in, say, a year’s time or its rate of return. Such point forecasts are part and parcel of the investment industry. In fact, forecasts about all sort of things – from the environment to economics to politics to sport – have become part of everyday life.

Economic and investment-related forecasts are useful as a means of communicating a view, as an input to the construction of budgets and as a base case against which to assess risks and formulate economic policy. But one of the big lessons I have learnt over the years is that relying too much on precise forecasts when making investment decisions regarding the asset allocation of multi asset funds (ie, funds that have exposure to a range of assets like cash, bonds, property, infrastructure and equities) can be dangerous. This was amply demonstrated during the global financial crisis (GFC), but has always been apparent.1 In particular, there is often a big difference between being right – ie, getting some forecast right – and making money. And of course, as Ned Davis has pointed out, for investors the key is to make money, not to be right.

If forecasting was easy I wouldn’t be writing this…

…and you wouldn’t be reading it! We would be very rich and sipping champagne in the south of France (or something like that!). As my first manager used to tell me “forecasting is difficult because it concerns the future”. The difficulty of getting economic forecast right is reflected in the long list of jokes about economists and their forecasts. Here’s some:

  • Three economists went target shooting. The first missed by a metre to the right, the second missed by a metre to the left and the third exclaimed “we got it”.

  • Economists were invented to make weather forecasters and astrologers look good.

  • An economist is a trained professional paid to guess wrong about the economy.

  • An economist will know tomorrow why the things she or he predicted yesterday didn’t happen.

  • Economic forecasting is like driving a car blindfolded and getting instruction from a person looking out the rear window.

  • Economics is the only field in which two people can share a Nobel Prize for saying the complete opposite.

  • For every economist there exists an equal and opposite economist.

  • Economists have predicted six of the last two recessions.

  • There are two classes of forecasters: those who don’t know and those who don’t know they don’t know (J.K. Galbraith).

Hit and miss

Surveys of economic forecasts are regularly compiled and published in the media. It is well known that when the consensus (or average) forecast is compared to the actual outcome, it is often wide of the mark. This is particularly so when there has been a major change in direction for the variable being forecast – such as around events like the tech wreck in the early 2000s and the GFC. This applies not only to economists’ forecasts for economic variables, but also to share analysts’ forecasts for company profits and to most forecasts across most disciplines except those where precise linear relationships apply (where A = B, eg in predicting the date and time of the next eclipse as opposed to the non-linearity in economics and investing and most things people like to forecast where a slight shift in the balance can result in A = B or C or…).

And of course the bigger the call, invariably the bigger the miss. There are numerous examples of gurus using grand economic, demographic or financial theories – usually resulting in forecasts of “new eras” or “great depressions” – who may get their time in the sun but who also usually spend years either before, or after, losing money. For example, the gurus who foresaw a “new era” in the late 1990s – with books like Dow 36,000 – looked crazy in the tech wreck bear market of the early 2000s. And many of those who did get the tech wreck or GFC “right” were bearish years before and would have lost their fortune if they had shorted shares when they first got bearish.

Grand prognostications of doom can be particularly alluring, and wrong. Calls that the world is about to bump into some physical limit, causing some sort of “great disruption” (famine, economic catastrophe – all those sort of things!), have been made with amusing regularity over the last two hundred years: Thomas Malthus, Paul Ehrlich’s The Population Bomb of 1968, the Club of Rome report on The Limits to Growth in 1972, the “peak oil” fanatics who have been telling us for decades that global oil production will soon peak and when it does the world will be plunged into a Mad Max-style chaos. Such Malthusian analyses underestimate resources, the role of price increases in driving change and human ingenuity in facilitating it. And when you’re reading books like those from Harry S Dent about The Great Depression Ahead (2009), The Great Crash Ahead (2011) and The Demographic Cliff (2014), all of which had disaster happening well before now, just recall that there has been a long list of prognostications for a great depression, often linked to a debt-related implosion, the bulk of which turned out to be wrong. Amongst my favourites are Ravi Batra’s The Great Depression of 1990 – well, that didn’t happen so it was just delayed to The Crash of the Millennium that foresaw an inflationary depression, which didn’t happen either. Google “the coming depression” and you’ll find 72.3 million search results!

Psychology and forecasting

Forecasts for economic and investment indicators can be useful but quite clearly need to be treated with care:

  • Like everyone, forecasters suffer from psychological biases including the tendency to assume the current state of the world will continue, the tendency to look for confirming (not contrary) evidence in new information, the tendency to only slowly adjust forecasts to new information and excessive confidence in their ability to foresee the future.

  • Quantitative point forecasts – eg, that the S&P 500 will be 2450 by December 31 – convey no information regarding the risks surrounding the forecasts. They are conditional upon the information available when the forecast was made. As new information appears, the forecast should change. Setting an investment strategy for the year based on forecasts at the start of the year and making no adjustment for new information is often a great way to lose money.

  • In investment management, what counts is the relative direction of one investment alternative versus others – precisely where they end up is of little consequence.

  • The difficulty in forecasting financial variables is made harder by the need to work out what is already factored in to markets. And rules of logic often don’t apply. Benjamin Graham coined the term “Mr Market” (in 1949) as a metaphor to explain the share market. Sometimes Mr Market sets sensible share prices based on economic and business developments. At other times he is emotionally unstable, swinging from years of euphoria to years of pessimism. Trying to get a handle on that and presenting it as a precise forecast or a grand market call is not easy.

In the quest to be right, the danger is that clinging to a forecast will end up losing money.

Why are forecasts treated with such reverence?

So why are forecasts seen by many as central to investing? First, many see the world through the rear view mirror where everything seems clear and assume that the future must be easy to forecast too for anyone who has the expertise. Second, and more fundamentally, precise quantified forecasts seem to provide a degree of certainty in an otherwise uncertain world. People hate uncertainty and will try to reduce or remove it however they can. And if we don’t have the expertise, the experts must know. And finally, prognostications of doom can be alluring because investors suffer from a behavioural trait known as “loss aversion” in that a loss in financial wealth is felt much more distastefully than the beneficial impact of the same sized gain. This leaves us more risk averse and it also leaves us more predisposed to bad news stories as opposed to good news stories. Flowing from this, prognosticators of gloom are more likely to be revered as deep thinkers than are optimists.

What to do? Three things to consider

While I like to think that I and my colleagues are better than the market, I know that if we simply relied on point forecasts for key investment market variables (like the share market, bond yields and the exchange rate) to set our investment strategy, it may not be the best way to make money for our clients. So in embarking upon investing, what should one do? In my opinion, there are three things to consider in the light of this note.

First, don’t over rely on expert forecasts. While point forecasts can help communicate a view, the real value in investment experts – the good ones at least – is to provide an understanding of the issues around investment markets and to put things in context. While financial history does not repeat, it does rhyme and so in many cases we have seen a variant of what may be currently concerning the market before. This is particularly important in being able to turn down the noise and focus on a long-term investment strategy designed to meet your investment goals.

Second, invest for the long term. In the 1970s, Charles Ellis, a US investment professional, observed that for most of us investing is a loser’s game. A loser’s game is a game where bad play by the loser determines the victor. Amateur tennis is an example where the trick is to avoid stupid mistakes and thereby win by not losing. The best way for most investors to avoid losing at investments is to invest for the long term. Get a long-term plan that suits your level of wealth, age, tolerance of volatility, etc, and stick to it. Alternatively, if you can’t afford to take a long-term approach or can’t tolerate short-term volatility, then it is worth considering investing in funds that use strategies like dynamic asset allocation to target a particular goal – be that in relation to a return level or cash flow.

Finally, if you are going to actively manage your investments, make sure you have a disciplined process. Ideally, this should rely on a wide range of indicators – such as valuation measures (ie, whether markets are expensive or cheap), indicators that relate to where we are in the economic and profit cycle, measures of liquidity (or some guide to the flow of funds available to invest), measures of market sentiment (the crowd is often wrong) and technical readings based on historic price patterns. The key to having a disciplined process is to stick to it and let the “weight of indicators” filter the information that swirls around financial markets so you are not distracted by the day-to-day soap opera engulfing them. Forecasting should not be central to your process. My preference is to focus on key themes as opposed to precise point forecasts.

Conclusion

It is always tempting to believe that you or someone else can perfectly forecast the market. However, as Ringo Starr said “it don’t come easy”! There are plenty of investors who have been “right” on some particular market call but lost a bundle by executing too early or hanging on to it for too long. The key is to know where expert views can be of use, but stick to a strategy designed to attain your goals and if you are going to actively manage your investments have a disciplined process.

1This note is an update of “Making money versus being right in the loser’s game”, Oliver’s Insights, September 2006.

Source: AMP Capital 31 May 2017

About the Author

Dr Shane Oliver, Head of Investment Strategy and Economics and Chief Economist at AMP Capital is responsible for AMP Capital’s diversified investment funds. He also provides economic forecasts and analysis of key variables and issues affecting, or likely to affect, all asset markets.

Important note: While every care has been taken in the preparation of this article, AMP Capital Investors Limited (ABN 59 001 777 591, AFSL 232497) and AMP Capital Funds Management Limited (ABN 15 159 557 721, AFSL 426455) makes no representations or warranties as to the accuracy or completeness of any statement in it including, without limitation, any forecasts. Past performance is not a reliable indicator of future performance. This article has been prepared for the purpose of providing general information, without taking account of any particular investor’s objectives, financial situation or needs. An investor should, before making any investment decisions, consider the appropriateness of the information in this article, and seek professional advice, having regard to the investor’s objectives, financial situation and needs. This article is solely for the use of the party to whom it is provided.

Around May each year I normally get a bit wary about the risks of a pullback in shares. It seems the old saying “sell in May and go away…” is permanently stuck in my mind. And of course shares have had a great run since their global growth scare “bear market” lows in February last year to their recent highs with global shares up 31% and Australian shares up 25%, and both saw good gains year to date to their recent highs of 7% and 5% respectively. Meanwhile, although there have been several calls this year that the so-called “Trump trade” – anticipation of his pro-business policies that supposedly drove the surge in shares since the US election – is over, the risks have intensified lately given the issues around Trump, the FBI and Russia with some fearing the Trump trade is now set to reverse. This note looks at the main issues.

Trump trade or Trump bump

It’s now six months since Donald Trump was elected President of the US and four months since he was inaugurated. In many ways, it has gone better than feared: he has not withdrawn the US into isolationism, there has been no trade war with China, he has appeared more focussed on pro-business policies such as deregulation and tax reform than populist policies, and he appears far more supportive of the Federal Reserve under Janet Yellen than feared. But by the same token, many would see the events of the last two weeks – his firing of FBI director James Comey when it’s in the midst of looking into the links between Trump’s campaign and Russia, claims he may have attempted to influence the FBI to stop its investigation and reports he shared classified material with Russian officials all surrounded by a barrage of tweets and leaks – as confirming that his narcissism, short fuse, erratic nature and divisive approach render him unfit to be president. Comparisons to Nixon and talk of impeachment seem to be growing by the day.

In terms of investment markets, a common view seems to be that the “Trump trade” drove the surge in global share markets since the US election and that this will now reverse because of the political crises now surrounding Trump. However, this is too simplistic. First, the main reason for the rally in shares since last November has been the improvement in economic conditions and surging profits that has occurred globally and which had little to do with Trump. Second, unless things become terminal for Trump quickly the political crisis around him is more likely to speed up his pro-business reform agenda than slow or stop it. In this regard, the following are worth bearing in mind:

  • The process to remove a president by impeachment is initiated by the US House of Representatives and can be for whatever reason the majority of the House decides and conviction, removal from office, is determined by the Senate and requires a two-thirds majority.1

  • At present, Republicans control the House with a 21-seat majority and won’t vote for impeachment unless it’s clear that Trump committed a crime (and so far it isn’t obvious that he has) and/or support for him amongst Republican voters (currently over 80%) collapses.

  • However, Trump’s overall poll support is so low that if it does not improve the Democrats will gain control of the House at the November 2018 mid-term elections and they will likely vote to impeach him (they will almost certainly find something to base it on much like the Republican Congress found reason to impeach President Clinton) and then it’s a question of whether Trump can get enough support amongst Republican Senators to head off a two-thirds Senate vote to remove him from office (as Clinton did).

In short, Republicans only have a window out to November next year to get through their pro-business reforms. And the more the politics around Trump worsens, the more they need a win. So if anything, the current mess speeds up the urgency to get tax and other pro-business reforms done because after the mid-terms they probably won’t be able to. On this front, work on tax reform is continuing and Trump’s infrastructure plan looks likely to be announced soon.

The impact of past impeachments on the US share market is mixed and proves little. The unfolding of the Watergate scandal through 1973-74 occurred at the time of a near 50% fall in US shares but this was largely due to deep recession and double-digit inflation at the time. (President Nixon resigned before impeachment.) President Clinton’s impeachment had little share market impact but was in the midst of the tech bull market.

Correction risks and seasonality

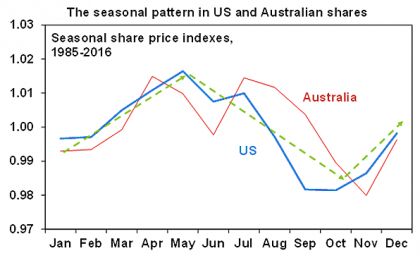
Share markets have had a great run and are arguably due a decent (5% or so) correction as a degree of investor complacency has set in. The latest scandals around Trump along with various other risks – North Korea and the ongoing march of Fed rate hikes – could be the trigger. (Corruption scandals in Brazil are a sideshow and are unlikely to have much impact beyond Brazil.) And it’s well known that the best time for shares is from November to May and the worst time is from May to November. This can be seen in the next chart, which shows the seasonal pattern in share markets since 1985.


Source: Bloomberg, AMP Capital

Most major share market falls have occurred in the May to October period (1929, 1987, worst of GFC, etc). Hence the old saying “sell in May and go away, come back on St Leger’s Day” still resonates. The seasonal pattern reflects tax loss selling by US mutual funds around the end of their tax year that sees them sell losing stocks around September in order to reduce capital gains tax bills, followed by having to buy shares back in November, the investment of year-end bonuses, New Year optimism and the absence of capital raising over Christmas and New Year all serving to drive shares higher from around October/November, which then peters out around May giving way to weakness that’s accentuated by tax loss selling in the September quarter. The only difference in Australia is that July tends to see a strong boost (as investors buy back after tax loss selling), but it otherwise follows the same pattern as the US.

Five reasons for optimism

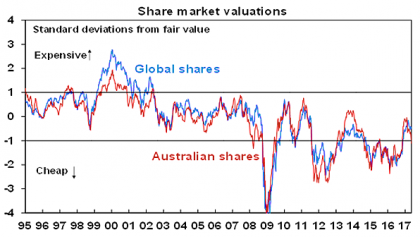
However, beyond current short-term risks and threats, there are several reasons for optimism. First, valuations for most share markets are not onerous. While price to earnings multiples for some markets are a bit above long-term averages, that is not unusual in an environment of low inflation. Valuation measures that allow for low bond yields show shares to no longer be as cheap as a year ago but they are still not expensive.


Source: Thomson Reuters, AMP Capital

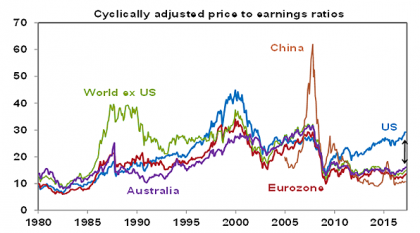
Second, while the US share market may be vulnerable on some measures, other share markets are not. If US shares are compared to a ten-year moving average of earnings (referred to as a Shiller or cyclically adjusted PE) then they are expensive and of course monetary conditions in the US are gradually tightening. However, the so-called Shiller PE remains cheap for most markets globally including Eurozone and Australian shares (next chart). Note also the last ten years include the GFC earnings slump and this will drop out next year, which will see the Shiller PE fall in most countries including the US.


Source: Global Financial Data, AMP Capital

Third, global monetary conditions remain easy and in the absence of broad-based excess (in growth, debt or inflation) look likely to remain so. The Fed is likely to hike rates two more times this year and start allowing its balance sheet to run down later this year but it’s still from a very easy base & other central banks are either on hold or easing. So a shift to tight money bringing an end to the economic cycle looks a fair way off.

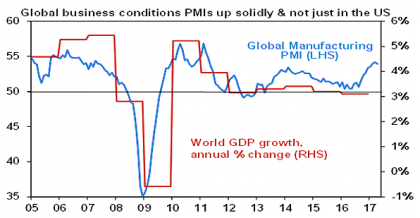
Fourth, global economic growth is looking healthier. Global business conditions indicators (or PMIs) are strong (next chart), the OECD’s leading economic indicators have turned up, jobs markets are tightening and for the first time in years the IMF has been revising up (not down) its estimates of global growth. US growth looks to be bouncing up again after a seasonal soft spot early this year, Chinese economic growth appears to be stabilising around 6.5% after an earlier upswing, Japanese growth looks to be good, the Eurozone looks strong and Australia is continuing to muddle along (not great but not bad – but nevertheless highlighting the ongoing case for Australian investors to have a decent global equity exposure).


Source: Bloomberg, AMP Capital

Fifth, profits are strong: US profits are up 14% year on year, Japanese profits are up 15%, Eurozone profits are up 24% and Australian profits look set to rise 20% this financial year.

Concluding comment

After strong gains over the last year and a strong start to the year until their recent highs, shares are vulnerable to a short-term correction as we go through seasonally weaker months. The political scandal around Trump, North Korea and Fed worries could all be a trigger. However, with most share markets offering reasonable value, global monetary conditions remaining easy and global growth and profits looking good, the trend in shares is likely to remain up.


Source: AMP Capital 23 May 2017

1The alternative to impeachment would be where Vice President Pence and Trump’s Cabinet remove him from office under the 25th Amendment of the Constitution which is aimed at dealing with a President who has become mentally incapable. While some may claim this should have happened from the start, it’s doubtful that Pence and Trump’s Cabinet see it that way!

About the Author

Dr Shane Oliver, Head of Investment Strategy and Economics and Chief Economist at AMP Capital is responsible for AMP Capital’s diversified investment funds. He also provides economic forecasts and analysis of key variables and issues affecting, or likely to affect, all asset markets.

Important note: While every care has been taken in the preparation of this article, AMP Capital Investors Limited (ABN 59 001 777 591, AFSL 232497) and AMP Capital Funds Management Limited (ABN 15 159 557 721, AFSL 426455) makes no representations or warranties as to the accuracy or completeness of any statement in it including, without limitation, any forecasts. Past performance is not a reliable indicator of future performance. This article has been prepared for the purpose of providing general information, without taking account of any particular investor’s objectives, financial situation or needs. An investor should, before making any investment decisions, consider the appropriateness of the information in this article, and seek professional advice, having regard to the investor’s objectives, financial situation and needs. This article is solely for the use of the party to whom it is provided.

Sugar is emerging as one of the most prominent investment risks for the global food and beverage industry. Science has linked high sugar consumption to obesity and Type 2 diabetes at a time when obesity rates are rising and healthcare costs for governments are growing.


Globally, 39% of adults worldwide are overweight1. The number of obese adults doubled between 1980 and 20142. China is expected to have the highest number of obese children in the world by 20253. There is already three times the number of teenagers in China with diabetes than in the US4.

In fact, obesity alone accounts for 21% of healthcare spending5 in the US and in the UK, 10% of the NHS budget is spent on Type 2 diabetes6.

A long-term trend toward health and wellness is already limiting the growth profile of companies manufacturing and selling products with high sugar content. This would deepen materially if any of the following occurs:

  • Increased public concern from medical and public health organisations about the health impact of sugar consumption and greater awareness from consumers about the sugar content of food.

  • Clear numbers on the cost of delivering health services to combat obesity. This would create the political will to impose sugar taxes, nutrition labels and/or advertising restrictions in an attempt to reduce consumption.

  • Scientific evidence that sugar is the cause of particular diseases that cause death, which may enable large-scale litigation.

There are early signs that the first two are occurring. The World Health Organisation halved its recommended proportion of daily calories from sugar to six teaspoons a day in 2015 and publicly called for governments to impose sugar taxes on beverages for the first time in 20167.

There is evidence of increasing numbers of consumers making healthier food choices. Soft drink sales for some listed companies are flat lining or trending lower and processed food purchases per capita are down in some markets.

Some countries and states are already responding with sugar taxes. There are now soda (soft drink) taxes in Mexico, the UK, Philadelphia in the US (the first large US state to impose a tax on soda), the city of Berkeley in California, and there is a current proposal in Ireland. Thirty-three cities in the US have attempted to introduce some form of soda tax. There are restrictions around advertising to children in Mexico and France and nutrition labels that include sugar content are being imposed for the first time in the US.

In Australia, the Greens have a soda tax on its policy platform and the party has said it will introduce a private senator’s bill by the end of 2017 if the Federal Government does not move to introduce one of its own.

While the major parties in Australia do not yet have plans to introduce any form of soda tax, the public discussion generated by the possibility of a soda tax has the potential to reduce consumption given that it shines a spotlight on the issue and accelerates consumer education about the health impacts of sugar.

We believe these discussions will step up a notch during 2017.

For more information on ESG issues, please see our latest corporate governance report.


Source: AMP Capital 7 April 2017

World Health Organisation Obesity and Overweight fact sheet, June 2016
As above.
Planning for the worst: estimates of obesity and comorbidities in school-age children in 2025 by Lobstein & Jackson-Leach, Pediatric Obesity, September 2016
S. Yan, J. Li, S. Li, B. Zhang, S. Du, P. Gordon-Larsen, L. Adair, B. Popkin The expanding burden of cardiometabolic risk in China: the China Health and Nutrition Survey, Obesity Reviews Volume 13, Issue 9, September 2012
https://www.hsph.harvard.edu/obesity-prevention-source/obesity-consequences/economic/
https://www.gov.uk/government/news/five-million-people-at-high-risk-oftype-2-diabetes
World Health Organisation Fiscal policies for diet and the prevention of noncommunicable diseases – Technical meeting report, published October 2016

While every care has been taken in the preparation of this document, AMP Capital Investors Limited (ABN 59 001 777 591, AFSL 232497) and AMP Capital Funds Management Limited (ABN 15 159 557 721, AFSL 426455) make no representations or warranties as to the accuracy or completeness of any statement in it including, without limitation, any forecasts. Past performance is not a reliable indicator of future performance. This document has been prepared for the purpose of providing general information, without taking account of any particular investor’s objectives, financial situation or needs. An investor should, before making any investment decisions, consider the appropriateness of the information in this document, and seek professional advice, having regard to the investor’s objectives, financial situation and needs. This document is solely for the use of the party to whom it is provided.

We spoke to some of our investment professionals to get their views on how the Federal Budget has impacted their respective asset classes.
John Julian, Investment Director – Direct Infrastructure
Shift in approach to funding infrastructure projects

Michael Kingcott, Head of Property Investment Strategy
Tackling softness and a lack of investment

Andrew Scott, Senior Portfolio Manager – Fixed income
Is the Budget inconsequential for bonds?

Michael Price, Head of Australian Fundamental Equities
Budget may put downward pressure on the Australian dollar

Read full article >>

If you would like to discuss anything in this article, please call us on Phone: 07 5641 4134.

In January 2016 the Australian dollar fell to just above $US0.68, its lowest level since 2009 and down 38% from its 2011 high. But since then, after a brief rebound, it has been stuck in a range between $US0.72 and $US0.78, defying our expectations for a decline. This note looks at why the $A has been so resilient over the last year, why we still think its longer term downtrend will resume and what it all means for investors.

What drives the $A?

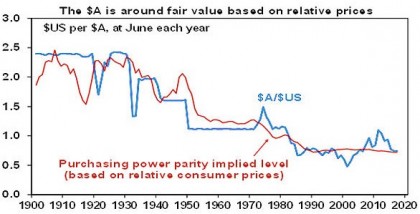
Over the long term, the Australian dollar tends to move in line with relative price differentials. This is the theory of purchasing power parity (PPP) according to which exchange rates should equilibrate the price of a basket of goods and services across countries – see the next chart. So if over time Australian inflation and costs rise relative to US inflation and costs, then the value of the $A should fall relative to the $US to maintain its real purchasing power and competitiveness. But in the short to medium term, swings in the $A are largely driven by swings in the prices of Australia’s key commodity exports and hence the terms of trade (when they go up the $A tends to rise and vice versa) and relative interest rates such that a rise in US rates relative to Australian rates makes it more attractive to park money in the US and hence pushes the $A down and vice versa. The positioning of investors also has an impact in the short term. Suppose investors are underweight the $A and then commodity prices rise encouraging them to close their underweights – this can add to upwards pressure on the $A.

Why the bounce a year ago & relative “stability” since?

These shorter-term forces were evident in the Australian dollar’s bounce back from below $US0.70 in January last year and relative stability in the $A since.

First, late in 2015 and early last year there was a lot of negative sentiment towards Australia with talk about a “big short” in property, banks and the $A as another round of calls for a crash in property prices did the rounds. This contributed to a big build up in speculative short or underweight positions, which left the $A vulnerable to positive news and set the scene for a rebound.

Second, the prices for Australia’s key industrial commodity exports – iron ore, coal, metals and energy – all rose sharply pushing Australia’s terms of trade up significantly.

Third, the US Federal Reserve delayed raising interest rates last year and this reduced upwards pressure on the $US.

Fourth, while RBA rate cuts last year helped prevent the $A from rising through $US0.78, so far this year there has been a feeling that Australian interest rates have bottomed and the next move is up with some saying later this year.

Finally, the rebound and then relative resilience in the $A has been consistent with a “risk on” environment as the $A is seen as a “risk on” currency, ie it’s strong when global conditions and growth assets improve and it’s weak when they deteriorate.

Three reasons why the $A is likely to fall

At current levels, the Australian dollar is roughly where it should be against the $US on a purchasing power parity basis. This is apparent in the next chart which shows where the $A should have been over time if it had moved to equilibrate relative consumer price levels between the US and Australia.

$A is around fair value based on relative prices
Source: RBA, ABS, AMP Capital

Right now, fair value on this measure is around $US0.75, which is not far from the current level for the $A. But as can be seen, the $A rarely spends much time at the purchasing power parity level and tends to be pushed to extremes above and below it.

Our assessment is that a resumption of the downtrend in the $A seen since 2011 is likely for three reasons.

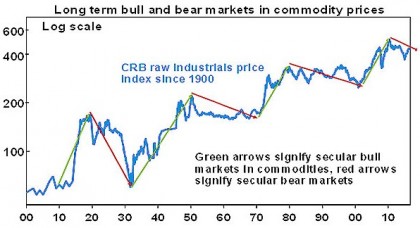
First, commodity prices likely remain in a long-term downtrend thanks to a surge in supply after record investment in resource projects. Raw material prices go through roughly 10 year upswings followed by 10 to 20 year downswings. These long-term moves reflect long lags in supply. For example, if commodity prices surge after years of undersupply, producers initially don’t believe it’s sustainable but, after several years, start to invest in new supply by which time the cycle is peaking. Then, when the new supply comes on stream it accentuates the downswing and it all repeats in reverse.

Long term bull and bear markets in commodity prices
Source: Global Financial Data, Bloomberg, AMP Capital

Of course there are cyclical swings in commodity prices within these long-term moves and the recent bounce in commodity prices was one of those, but the iron ore price has since come back down again and oil prices have struggled to maintain upwards momentum with rising supply constraining both.

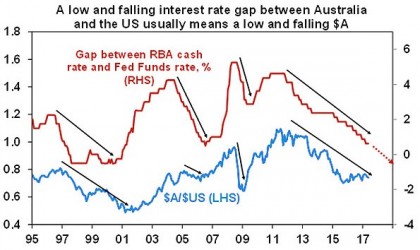
Second, the interest rate differential in favour of the $A is likely to narrow further as the Fed continues to hike rates and the RBA remains on hold or maybe even cuts rates. This will make it relatively less attractive to park money in Australia putting downwards pressure on the $A. The Fed is on track to hike rates again in June and September as the US economy continues to improve as highlighted by a tightening jobs market. This will take the Fed Funds rate to a range of 1.25-1.5%. If the RBA leaves rates on hold at 1.5%, which is our base case, then the gap between Australian and US official interest rates will have virtually closed by September, from 4.5% in 2011. As the next chart shows, periods of a low and falling official interest rate differential between Australia and the US usually see a low and falling Australian dollar.

Low falling interest rate gap between Australia and US
Source: Bloomberg, AMP Capital

While our base case is that the RBA is on hold, there is a high risk that it may have to cut rates again later this year as we may go through a bit of a soft patch in growth, which is contrary to the RBA’s own forecasts. The contribution to growth from housing is set to slow as falling building approvals flows through to slowing housing construction and slowing home price gains in Sydney and Melbourne dampen wealth effects, at a time when consumer spending is subdued, mining investment is still falling and cyclone Debbie has disrupted coal export volumes.

Public infrastructure spending will provide an offset but there is a risk of another negative quarter for GDP in either the March quarter just passed or the current June quarter or at least subdued growth in both. Which in turn points to continuing high underemployment and record low wages growth. All of which suggests downside risks to inflation. Against this backdrop, we ideally need the $A to fall further to help support growth in export-oriented sectors like tourism and higher education to help boost overall economic growth. The bottom line though is that there is more risk that the RBA will cut rates than hike them by year end and if the RBA does cut, the interest rate differential in favour of the $A will go negative this year.

Of course the financial stability risks associated with continued strength in the Sydney and Melbourne residential property markets have been cited as a significant constraint on the RBA cutting rates again, but this constrain looks like it will fade over the next six months. The peak in home price growth in these cities has likely been seen with the combination of bank rate hikes, tightening lending standards, surging unit supply and a reduction in expenses that can be claimed under negative gearing all likely to help drive a slowing going forward.

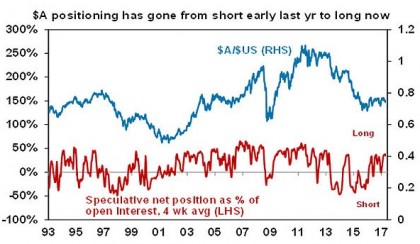
Third, speculative positioning in the $A has gone from short at the lows early last year to long now, which leaves the $A vulnerable to any further commodity price softness, Fed rate hikes and or RBA cuts.

$A positioning has gaone from short early last yr to long now
Source: Bloomberg, AMP Capital

In short, our assessment is that the $A will resume its downswing and will likely fall below $US0.70 by year end.

What does it mean for investors?

With the risks skewed towards more downside in the value of the $A, there are several implications for investors.

First, there remains a strong case to maintain a decent exposure to offshore assets that are not hedged back to Australian dollars. A decline in the value of the $A boosts the value of an investment in offshore assets denominated in foreign currency by one for one. This can be seen over the last five years where the fall in the value of the $A turned a 12.2% per annum (pa) return from global shares measured in local currencies (US dollars, Yen, Euros, etc) into a 17.7% pa return for Australian-based investors when measured in Australian dollars. Over the same period, Australian shares returned 11% pa which is good, but it paid to have money in global shares, particularly on an unhedged basis.

Second, if the global outlook turns sour, having an exposure to foreign currency provides a useful hedge for Australian-based investors as the $A usually falls (and foreign currencies rise) in response to weaker global growth.

Finally, a further leg down in the value of the $A would be positive for Australian sectors that have to compete internationally like tourism, higher education, manufacturing, agriculture and mining.

If you would like to discuss anything in this article, please call us on Phone: 07 5641 4134.


Source: AMP Capital 17 May 2017

About the Author

Dr Shane Oliver, Head of Investment Strategy and Economics and Chief Economist at AMP Capital is responsible for AMP Capital’s diversified investment funds. He also provides economic forecasts and analysis of key variables and issues affecting, or likely to affect, all asset markets.

Important note: While every care has been taken in the preparation of this article, AMP Capital Investors Limited (ABN 59 001 777 591, AFSL 232497) and AMP Capital Funds Management Limited (ABN 15 159 557 721, AFSL 426455) makes no representations or warranties as to the accuracy or completeness of any statement in it including, without limitation, any forecasts. Past performance is not a reliable indicator of future performance. This article has been prepared for the purpose of providing general information, without taking account of any particular investor’s objectives, financial situation or needs. An investor should, before making any investment decisions, consider the appropriateness of the information in this article, and seek professional advice, having regard to the investor’s objectives, financial situation and needs. This article is solely for the use of the party to whom it is provided.

There are plenty of upsides to buying an investment property that already has a tenant, as well as a raft of risks. Here’s how to minimise them.

  • Purchasing an investment property that already has a tenant means you collect rent from day one, with no vacant period and no lease fees to find a new tenant. The lease just carries on as it did before you purchased the property. Sound good? Of course it does. There are some possible problems to be aware of though.

  • It’s very important to check whether the lease on your prospective investment is current or the tenants are on an expired lease. If the tenants are off-lease, they can give a short period of notice and vacate the property, so those upsides mentioned above could come to nought.

  • A current lease, on the other hand, offers security, it also means that you are stuck with the lease, its conditions (or lack thereof), the current rental return and the tenants.

  • There are steps you can take to minimise your risk:

  • Make sure the bond has been lodged properly. Your agent will arrange for the bond guarantee to be transferred into your name on settlement.

  • Check the property condition report, making sure that it is a complete and accurate record of the property as you inspected it.

  • Ensure there are no rental arrears. If there are, or if a landlord has agreed that rental arrears can be taken out of a bond payment, stipulate that this amount is deducted from the purchase settlement amount.

  • Ask the leasing agent about the tenants and their payment record. You cannot demand that you meet the tenants, but attending the open house will give you a sense of how they live in the property. If possible, sight the tenants’ original application for the property and rental ledger.

  • Look at the yield for rental properties in the area and compare them to yours. You won’t be able to increase the rent until the end of the lease.

  • Be aware of any concessions or conditions that are either in the lease or have been agreed with the landlord or property manager, because these will become your responsibility. For example, does rent include electricity or other utilities? Has the landlord agreed to install a new oven or paint a room?

  • Of course, if you love a property but have doubts about the tenants, the lease or the managing agent, all is not lost. You can easily change the managing agent when you settle. You can also make vacant possession of the property a condition of settlement. You may need to wait until the lease expires to settle, but you aren’t taking on the previous owners’ problems and responsibilities.

If your only problem with a tenanted property is the rental yield, keep in mind that increasing rent on a good, long-term tenant may well drive them away anyway, so do your sums. Work out whether the amount you’d like to increase the rent by equates to more over the year than the lease fee plus any rent lost if your property is vacant for a few weeks.

If you would like to discuss, please call us on Phone: 07 5641 4134 or email martin@wtfp.com.au.


Source:

Reproduced with the permission of the Mortgage and Finance Association of Australia (MFAA) 

Important:

This provides general information and hasn’t taken your circumstances into account. It’s important to consider your particular circumstances before deciding what’s right for you. Although the information is from sources considered reliable, we do not guarantee that it is accurate or complete. You should not rely upon it and should seek qualified advice before making any investment decision. Except where liability under any statute cannot be excluded, we do not accept any liability (whether under contract, tort or otherwise) for any resulting loss or damage of the reader or any other person.

Any information provided by the author detailed above is separate and external to our business and our Licensee. Neither our business, nor our Licensee take any responsibility for their action or any service they provide.

What are the best countries for a comfortable retirement? What countries have the best retirement-income systems? It seems the answers to these questions are rather positive for Australian retirees.

The recently-published 2017 Best Countries survey from US News & World Report, BAV Consulting and the Wharton School at the University of Pennsylvania ranks Australia as the world’s second-best country for a comfortable retirement – behind New Zealand and ahead of Switzerland, Canada and Portugal in the top five.

Survey respondents aged 45 years and up ranked the best countries for retirement on seven attributes: affordability, favourable tax environment, friendliness, “a place I would live”, pleasant climate, respect for property rights and a well-developed public health system.

The questions were asked in the context of where a person would consider moving to upon retirement if cost were no object. It is worth noting that the Best Countries survey did not seek views about the adequacy of a country’s retirement-income systems.

Up to approximately 21,000 survey participants from around the world were asked to grade countries under such headings as best countries overall (Australia came eighth with Switzerland taking first place), best countries for women (Australia sixth), quality of life (Australia fourth), best countries to invest in (Australia 22nd) and best countries for a comfortable retirement.

The latest Melbourne Mercer Global Pension Index, as discussed by Smart Investing late last year, once again ranked Australia’s retirement-income system third out of 27 countries assessed (accounting for 60 per cent of the world’s population) in terms adequacy, sustainability and integrity. While Australia was given a B-plus, the front-runners – Denmark followed by the Netherlands – received A grades.

Australia’s high rating in the pension survey was largely due to our “robust” superannuation system and Government-funded age pension, but “there was work to be done” to achieve an A grade.

Irrespective of each country’s social, political, historical and economic influences, the pension report stresses that many of their challenges in dealing with an ageing population are similar. These include encouraging people to work longer, the level of retirement funding and reducing the” leakage” of retirement savings before retirement.

Although the suggestions of the Global Pension Index are directed mainly at government and the pension/retirement sectors, individuals may pick up useful personal pointers from most of its suggestions to, perhaps, discuss with a financial planner. In other words, consider taking a personal perspective on this global retirement-incomes challenge.

These personal pointers may include:

  • Think about whether to work until an older age than initially intended. The longer a person remains in the workforce, the greater the opportunity to save for what will be a shorter and therefore less-costly retirement. (An individual’s ability to work longer will much depend, of course, on personal circumstances including health and employment opportunities.)

  • Try to save more in super within the annual contribution caps. And if self-employed, consider making voluntary super contributions. Unlike employees, the self-employed in Australia are not required to save in super.

  • Think carefully before accumulating pre-retirement debt with the purpose of repaying it with super savings – it could reduce your standard of living in retirement. This is part of the pre-retirement “leakage” referred to by the Global Pension Index.

  • Take your superannuation pension rather than a lump sum upon retirement if possible. This will keep your savings in the concessionally-tax or tax-free super system for longer and, most importantly, make your retirement lifestyle as comfortable as possible for as long as possible. The report for the Global Pension Index suggests that one possible way to improve Australia’s retirement-income system might be to compel super members to take part of their super as a pension.

It’s comforting that thousands of people around the world regard Australia as one of the very best places for a comfortable retirement if they could afford to shift to another country after leaving the workforce and cost was not a barrier. And it must provide a degree of comfort that Australia’s retirement-income system is “relatively well placed” in the worlds of the Global Pension Index.

Unfortunately, other research has long shown that a large proportion of Australians have inadequate – often grossly inadequate – retirement savings.

As global retirement-income systems grapple with the demographic shift of an ageing population with declining birth rates and seemingly ever-greater longevity, individuals should be doing as much as they can to maximise their own retirement savings.

If you would like to discuss anything in this article, please call us on Phone: 07 5641 4134 or email martin@wtfp.com.au.


Source: 

Written by Robin Bowerman, Head of Market Strategy and Communications at Vanguard.

Reproduced with permission of Vanguard Investments Australia Ltd

Vanguard Investments Australia Ltd (ABN 72 072 881 086 / AFS Licence 227263) is the product issuer. We have not taken yours and your clients’ circumstances into account when preparing this material so it may not be applicable to the particular situation you are considering. You should consider your circumstances and our Product Disclosure Statement (PDS) or Prospectus before making any investment decision. You can access our PDS or Prospectus online or by calling us. This material was prepared in good faith and we accept no liability for any errors or omissions. Past performance is not an indication of future performance.

© 2017 Vanguard Investments Australia Ltd. All rights reserved.

Important:

Any information provided by the author detailed above is separate and external to our business and our Licensee. Neither our business, nor our Licensee take any responsibility for their action or any service they provide.