Changes aimed at improving housing affordability have passed through parliament. See what the new rules could mean for you. 

Government proposals around improving housing affordability in Australia were passed through parliament on 7 December 2017.

As part of the changes, first-home buyers will be given a tax concession through the ability to save for a home deposit inside of super, while Australians aged 65 and over will be able to contribute the proceeds from the sale of their main residence (up to $300,000) into super.  

Meanwhile, we take a look at what the changes could mean for first home buyers, bearing in mind that like with all important financial decisions, it’s a good idea to get financial advice before deciding what’s right for you.

Tax concession for first home buyers

From 1 July 2018, eligible first home buyers will be able to withdraw voluntary super contributions (which they’ve made since 1 July 2017), along with associated investment earnings, to put toward a home deposit.

How does it work?

Under the First Home Super Saver Scheme (FHSSS), first home buyers who make voluntary contributions of up to $15,000 per year into their super can withdraw these amounts, in addition to associated earnings, from their super fund to help with a deposit on their first home.

If eligible, the maximum amount of contributions that can be withdrawn under the scheme is $30,000 for individuals or $60,000 for couples.

Voluntary contributions can be made by salary sacrificing from before-tax income, by making personal tax-deductible contributions, or by making personal after-tax super contributions.

When the money is withdrawn, before-tax and tax-deductible contributions are taxed at your marginal tax rate, less a 30% tax offset, while after-tax contributions aren’t subject to tax.

Due to the favourable tax treatment, generally available through super, this scheme intends to help first home buyers grow their deposit more quickly.

Things to note

To make a withdrawal under the scheme, an application to the ATO will be required, and an eligible person is only allowed one FHSSS withdrawal in their lifetime.

There are super contributions which will not qualify and cannot be withdrawn under the scheme, such as super guarantee contributions made by your employer, as well as spouse contributions.

FHSSS amounts that are withdrawn and not subsequently used for a property purchase must be put back into super as after-tax contributions, or penalties will apply.

The first home buyer must reside at the property for at least six months in the first 12-month period from when it can be occupied.

Additional rules may apply to your situation, so make sure you do your research before making any decisions.

For further assistance please contact us on Phone: 07 5641 4134

Source : AMP 1 May 2018 

Important 
 
This article provides general information and hasn’t taken your circumstances into account. It’s important to consider your particular circumstances before deciding what’s right for you. Although the information is from sources considered reliable, we do not guarantee that it is accurate or complete. You should not rely upon it and should seek qualified advice before making any investment decision. Except where liability under any statute cannot be excluded, we do not accept any liability (whether under contract, tort or otherwise) for any resulting loss or damage of the reader or any other person.


So far this year geopolitical developments have been having a significant impact on investment markets. Most of these revolve in some way around President Trump and the US: with the threat of a trade war between the US and China (although “constructive” talks between the two add to confidence that a trade war will be averted); the Mueller inquiry concerning his campaign’s links to Russia (but like many such inquiries seems to be looking at other things too); the US decision to reimpose sanctions on Iran (and a resultant rise in oil prices); and recently (mostly) good news regarding North Korea.

Away from the US the other major geopolitical risk on investors’ radars at present concerns Italy. Last year the big concern was that the 2016 Brexit vote and Trump victory presaged a surge in support for populist Eurosceptic parties in elections in the Netherlands, France, Germany and Austria and that an independence vote in the Catalan region of Spain would also pose a threat, all contributing to increased risk of an eventual Eurozone break up. In the end no such thing happened. This year the concern is that the formation of a populist coalition government in Italy with Eurosceptic leanings will drive crisis in Italy and potentially threaten the Euro. I must admit that while I wasn’t worried about last year’s Eurozone elections the risks around Italy are greater. But a break up of the Euro triggered by Italy still looks very unlikely. And in the meantime, Eurozone shares remain attractive. This note looks at the main issues.

Populists take over in Italy

While the populists did not fare as well as many predicted in Europe last year the populist left-leaning Five Star Movement (5SM) and populist far-right Northern League (NL) were the big winners in the Italian elections in March. While neither won a majority on their own and a coalition between them was seen as the worst possible scenario given their background of Euroscepticism and support for irrational economic policies, despite their political differences they have agreed to do just that. They are proposing amongst other things: big tax cuts (with just two rates of 15% and 20% for companies and individuals); a basic income for the less well off; a roll back of pension reforms; and a review of European Union budget rules.

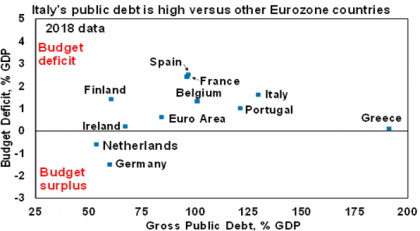
The resultant budget deficit blow out will create tensions with the EU at a time when Italian public debt at around 130% of GDP is the second highest amongst Eurozone countries and its budget deficit at around 1.6% of GDP is the third highest.


Source: IMF, AMP Capital. Note: Greek public debt looks worse than it is as Eurozone assistance has lengthened its maturity at very low rates.

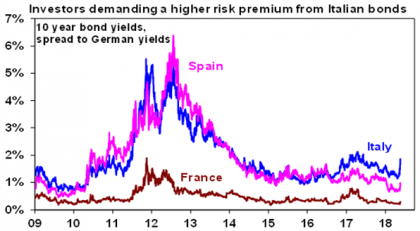
Which in turn risks significant upwards pressure on Italian bond yields. Northern League leader Matteo Salvini has naively bragged that “The spread [between Italian and German bond yields] is going up – do you remember the spread?”. Investors do and the gap between Italian and German bond yields has risen by 0.63% this month so Italy now pays 1.85% more than Germany to borrow for 10 years. This has put some upwards pressure on Spanish and Portuguese bond yields, although none are near the extremes of the 2011-2012 Eurozone crisis.


Source: Bloomberg, AMP Capital

This is also now weighting on Italian shares which after being outperformers over the last year as the Italian economy improved are now down 3.7% this month. Market and economic realities may eventually force 5SM and NL to water down their policies in government – which may explain why the leader of neither wants to be PM! In some ways this has echoes of Syriza in Greece that once promised extreme populist policies and an exit from the Euro but became just another centrist European political party. So it may turn out to be a non-event but it could still impose significant risk along the way (as the noise in Greece did) and suggests a cautious stance towards Italian assets – particularly shares and bonds.

Three reasons not to be too concerned about an Itexit

Given 5SM and NL’s background in Euroscepticism an Italian push for an exit from the Euro (Itexit) could emerge as an issue when Italy and the Eurozone next have an economic downturn. However, there are three reasons not to be too concerned about an Itexit and contagion to the rest of the Eurozone.

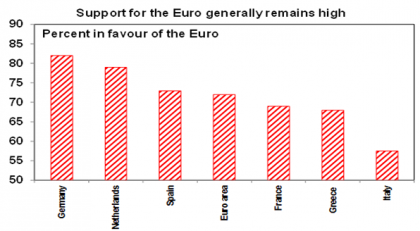
First, its not an imminent threat in Italy because while support for the Euro there is not as strong as it is elsewhere in the Eurozone, a majority of Italians support the Euro (with support actually rising from a year ago) and 5SM and NL only did well because they backed away from policies to exit the Euro.


Source: Eurobarometer, AMP Capital

Second, as Syriza and Greece have found exiting the Euro is easier said than done and would involve: currency redenomination; a probable sharp collapse in the value of the “new” Lira; a run on the banks, capital flight and a sharp rise in Italian bond yields as depositors, individuals, companies and investors try to move into harder currency; harsh fiscal austerity as funding for Italy’s 1.6% of GDP general budget deficit would evaporate; and a return to recession. This would likely see a 5SM/NL coalition government back away from an Itexit before it went too far – just as we saw Syriza do.

Third, the risk of contagion to the rest of the Eurozone is far less than it was earlier this decade:

  • other vulnerable countries like Spain, Ireland, Portugal and even Greece are now in much better shape (with lower budget deficits, stronger growth and falling unemployment);

  • more broadly, Eurozone break up risk may have peaked with the high point of the Eurozone debt crisis – when unemployment & fiscal austerity were at their peak in 2013. But unemployment has now fallen from 12% to 8.5% and fiscal austerity has ended. An end to the migration crisis may help too with sea arrivals collapsing since 2015; and

  • popular support for the Euro is solid at around 70% across the Eurozone and various countries showed by their elections last year they aren’t interested in exiting the Euro.

​While a break up in the Euro is unlikely, a populist coalition in government in Italy, which is the Eurozone’s third largest country, along with a deterioration in its budgetary position will keep fears of a threat to it alive (after they subsided following last year’s elections) and this will weigh on the Euro. Particularly in the short term until investors get a clearer handle on what a 5SM/NL coalition government in Italy will do.

Eurozone shares remain attractive

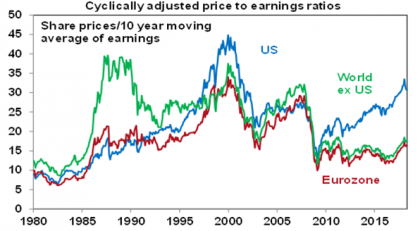
While question marks remain over Italy and this will weigh on the Euro, there is good reason to be optimistic regarding Eurozone shares. First, Eurozone shares are not expensive. They are trading on a price to forward earnings multiple of 14 times which is around its long-term average. And their cyclically adjusted price to earnings ratio which compares share prices to a ten-year moving average of earnings (often called a Shiller PE) is around 17 times compared to 32 times in the US. This is largely because Eurozone shares underperformed US shares in the post GFC period. Adjusting for relatively lower bond yields in Europe makes Eurozone shares even more attractive.


Source: Global Financial Data, AMP Capital

Second, the European Central Bank is still pumping cash into the economy and is a long way from rate hikes. Italian risk may keep it easier for longer. This contrasts to the Fed which is engaging in quantitative tightening and raising interest rates.

Third, the Euro is now falling. A rise in the Euro through last year – as Eurozone growth surprise on the upside relative to the US and political risk declined in the Eurozone relative to the US – harmed Eurozone shares. This is now reversing as US growth has started to accelerate relative to the Eurozone.

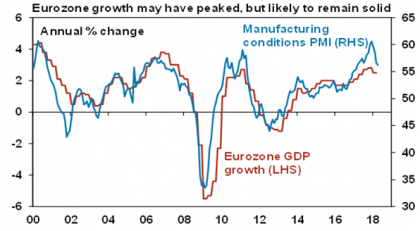
Finally, while Eurozone growth has slowed a bit it’s still good and thanks to ongoing monetary stimulus and a now falling Euro is likely to remain so. In turn this is good for profit growth.


Source: Bloomberg, AMP Capital

Key implications for investors

There are several implications for investors. Firstly, a populist coalition government in Italy is negative for Italian assets.

Second, it’s another drag on the Euro which along with relatively easier monetary policy and slower growth compared to the US is likely to see more downside against the US dollar (which probably means it tracks sideways against the $A).

Finally, Eurozone shares are likely to be relative outperformers notably versus US shares thanks to more attractive valuations, easier monetary policy and a falling Euro.  


Source: AMP Capital 22 May 2018

Important note: While every care has been taken in the preparation of this article, AMP Capital Investors Limited (ABN 59 001 777 591, AFSL 232497) and AMP Capital Funds Management Limited (ABN 15 159 557 721, AFSL 426455) makes no representations or warranties as to the accuracy or completeness of any statement in it including, without limitation, any forecasts. Past performance is not a reliable indicator of future performance. This article has been prepared for the purpose of providing general information, without taking account of any particular investor’s objectives, financial situation or needs. An investor should, before making any investment decisions, consider the appropriateness of the information in this article, and seek professional advice, having regard to the investor’s objectives, financial situation and needs. This article is solely for the use of the party to whom it is provided.

Cold weather and faulty appliances can be a dangerous combination in winter – especially if your home is underinsured.

As we head into winter, now is the time to check your home heating appliances – and your home and contents cover. The cooler months typically see an uptick in home insurance claims with a rise of up to 47% in colder states like New South Wales though Victoria leads the country for claims in winter. Sadly, these claims are often the result of fire damage caused by dodgy appliances.

Research shows some of the most common causes of home fires in winter involve embers escaping from open fireplaces, electric heaters being knocked over, faulty electric blankets and even bathroom heat lamps exploding when they become clogged with dust.
That makes it worth keeping your home safe by giving heating equipment a once-over and a thorough clean. If in doubt, consider replacing older appliances. It’s better to be safe than sorry.

Four out of five homes are underinsured

It also makes sense to check that your home and contents insurance is up to date. Winter doesn’t just bring increased risks of fire damage, it can also deliver some wild weather.

Most Australians have home building and contents insurance, but many of us don’t have enough cover to protect what may be our most valuable asset – and one that could go hand in hand with a substantial mortgage.

It’s estimated that four out of five Australian homes are underinsured – meaning the property is covered for less than 90% of rebuilding costs. It’s an easy trap to fall into because home owners, understandably, simply don’t know what it would cost to repair or rebuild their homes. Yet that’s exactly what the “sum insured” is supposed to represent. The bottom line is that a lot of people are relying on some very rubbery figures to insure their home.

Calculating rebuilding costs just got easier

Playing a guessing game with home insurance can mean finding yourself wildly out of pocket at claim time – something that can be financially and emotionally devastating. Frankly, it’s not worth the risk.

The good news is that a new home insurance calculator is available on the Understand Insurance website. It provides a clear picture of the likely cost to rebuild your home, and it’s based on data from building cost estimator Cordell using the most up to date information to provide real-time cost estimates.

The calculator is worth a look – a colleague put her home to the test and was amazed to see the cost to rebuild her place is double what she expected. It’s a problem that’s easily solved. Paying just a bit more in premiums often buys a lot more cover.

But it’s also important to have the right policy in place for your needs, and that’s something where people add a lot more value than online calculators.

Please contact us on Phone: 07 5641 4134 to be sure your home and contents cover is a good fit for your situation, your home and your budget.


Paul Clitheroe is a founding director of financial planning firm ipac, Chairman of the Australian Government Financial Literacy Board and chief commentator for Money Magazine.

Source : AMP 3 May 2018 


Important 
 
This article provides general information and hasn’t taken your circumstances into account. It’s important to consider your particular circumstances before deciding what’s right for you. Although the information is from sources considered reliable, we do not guarantee that it is accurate or complete. You should not rely upon it and should seek qualified advice before making any investment decision. Except where liability under any statute cannot be excluded, we do not accept any liability (whether under contract, tort or otherwise) for any resulting loss or damage of the reader or any other person.


Investing can be frustrating and depressing at times, particularly if you don’t understand how markets work and don’t have the right mindset. The good news is that the basics of investing are timeless, and some have a knack of encapsulating these in a sentence or two that is both insightful and easy to understand. In recent years I’ve written insights highlighting investment quotes that I find particularly useful. Here are some more.

Having a goal and a plan

“Financial peace isn’t the acquisition of stuff. It’s learning to live on less than you make, so you can give money back and have money to invest. You can’t win until you do this.” Dave Ramsey

The only way to be able to build wealth is to save and invest and you can only do this if you spend less than you earn. That is, you have to start with a savings plan.

“Put time on your side. Start saving early and save regularly. Live modestly and don’t touch the money that’s been set aside” Burton G Malkiel

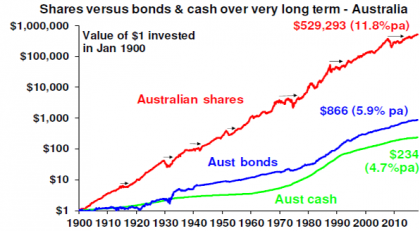
In investing time is your friend and the earlier you start the better. This is the best way to take advantage of the magic of compound interest. The next chart – my favourite – shows the value of $1 invested in various Australian asset classes since 1900 allowing for the reinvestment of any income along the way. That $1 would have grown to just $234 if invested in cash, $866 in bonds but a whopping $529,293 if invested in shares.  

Source: Global Financial Data, AMP Capital

While the average share return since 1900 is only double that in bonds, the huge gap in the end result between the two owes to the magic of compounding returns on top of returns. A growth asset like property is similar to shares over long periods in this regard. Short-term share returns bounce all over the place and they can go through lengthy bear markets (shown with arrows on the chart). But the longer the time period you allow to build your savings the easier it is to look through short-term market fluctuations and the greater the time the compounding of higher returns from growth assets has to build on itself.

“If you fail to plan, you plan to fail.” Often attributed to Benjamin Franklin

Having a clear understanding of your investment goals – like saving for a home or retirement or generating income to live on – and a plan to get there is critical. If you don’t have a clear plan you will be subject to all sort of distractions which can blow you a long way from where you want to get with your investments.

The investment cycle

“Bull markets don’t die of old age but of exhaustion.” Anon

Bear markets are invariably preceded by excess in the economy – over investment, high levels of debt growth, high levels of inflation and tight monetary conditions – and excess in the share market in the form of overvaluation and investor euphoria. It’s this excess which drives exhaustion and hence the end of a bull market, not its age.

“The stock market has predicted 9 of the past 5 recessions.” Paul Samuelson

In the short term the share market moves all over the place with each significant plunge eliciting calls for an impending recession and a deep bear market. But most of the time it’s just noise providing an opportunity for investors before a rebound. For example, over the past 50 years in the US there has been 21 episodes of 10% or greater share market falls, but only seven saw recessions and bear markets.

Risk

“The biggest investment risk is not the volatility of prices, but whether you will suffer a permanent loss of capital. Not only is the mere drop in stock prices not risk, but it is an opportunity.” Li Lu

Risk is often portrayed as market volatility when in reality it’s a whole lot more: the risk of capital loss; the risk of not having enough investment income; the risk of not having enough to last through retirement. It’s also perverse – the risk of capital loss is lowest after a period of high volatility and vice versa.

Contrarian investing

“The day after the market crashed on 19th October 1987, people began to worry that the market was going to crash” Peter Lynch

This is perhaps a bit flippant, but it goes to the heart of crowd psychology and why it’s best to go against the crowd at extremes. When times are good the crowd is relaxed, happy and fully invested. So everyone who wants to buy has. This leaves the market vulnerable to bad news because there is no one left to buy should prices drop. Similarly, after a sharp fall the crowd gets negative, sells their investments to the point that everyone who wants to sell has and so the market sets up for a rally when some good or less bad news comes along. So the point of maximum risk is when most are euphoric, and the point of maximum opportunity is when most are pessimistic.

Pessimism

“It is easier being sceptical, than being right.” Benjamin Disraeli

The human brain evolved in a way that it leaves us hardwired to be on the lookout for risks. So a financial loss is felt more negatively than the beneficial impact of the same sized gain. Consequently, it seems easier to be sceptical and pessimistic. As a result, bad news sells and there seems to be a never-ending stream of warnings regarding the next disaster. But when it comes to investing, succumbing too much to scepticism and pessimism doesn’t pay. Historically, since 1900 shares have had positive returns seven years out of 10 in the US and eight years out of 10 in Australia.

“A pessimist sees the difficulty in every opportunity, an optimist sees the opportunity in every difficulty.” Winston Churchill

This is what stops many investing after big falls – all they see are the reasons the market fell. Not the opportunity it provides.
 

“Without a saving faith in the future, no one would ever invest at all. To be an investor, you must be a believer in a better tomorrow.” Jason Zweig

If you don’t believe your term deposit is safe, that borrowers will pay back their debts, that companies will see good profits and that properties will earn rents then there is no point in investing.

Psychology

“An investment said to have an 80% chance of success sounds far more attractive than one with a 20% chance of failure. The mind can’t easily recognise that they are the same.” Daniel Kahneman

Beware of tricks that your mind plays on you when investing. Numerous studies show that people suffer from lapses of logic – eg, assuming the current state of the world will continue, being overly confident and assessing the risk of certain events by how they are presented. The key for investors is to be aware of these biases and try to correct them.

Noise

“Stock market news has gone from hard to find (in the 1970s and early 1980s), then easy to find (in the late 1980s), then hard to get away from.” Peter Lynch

The information revolution has given us access to an abundance of information and opinion regarding investment markets. The danger is that it adds to the uncertainty around investing resulting in excessive caution, a short-term focus, a tendency to overreact to news and to focus on things that are of little relevance. The key is to recognise that much of the noise and opinion around investing is ill informed and of little value.

“The ability to focus is a competitive advantage in the world today.” Harvard Business Review

The key in the face of this information and opinion onslaught is to turn down the noise and focus.  

“If you can keep your head when all about you are losing theirs…If you can wait and not be tired by waiting… If you can trust yourself when all men doubt you…Yours is the Earth and everything that’s in it.” Rudyard Kipling, If, as quoted by Warren Buffett 

Keeping your head and remaining calm is critical in times of extreme – when the crowd is convinced the path to instant riches has been revealed or when the crowd is convinced that economic disaster is upon us. These periods throw up great temptation to buy when you should be selling and vice versa. But you will only get it right if you keep your head & stay calm.

Forecasting

“I believe that economists put decimal points in their forecasts to show that they have a sense of humour.” William Gillmore Simms

The dismal track record of precise forecasts regarding things like economic growth, share prices and currencies indicates that relying on them when investing can be dangerous. There is often a big difference between getting some forecasts right and making money. Good experts will help illuminate the way and put things in context, so you don’t jump at shadows but don’t over rely on expert forecasts – particularly the grandiose ones.

Having a process

“I am going to reveal the grand secret to getting rich by investing. It’s a simple formula that has worked for Warren Buffett, Carl Icahn and the greatest investment gurus over the years. Ready? Buy low, sell high.” Larry Kudlow

Yep it’s that simple. Or it should be, but many do the exact opposite and buy high after a lengthy period of strong returns convinces people it’s a great investment (but the risks point down), and then sell low after fall in the price of an asset leads people to believe that it’s a bad investment (but that’s when the risks point up). The key to is do the opposite – buy low, sell high and it’s very helpful to have an investment process to do that.

“Three simple rules – pay less, diversify more and be contrarian – will serve almost everyone well.” John Kay

This helps bring the essentials of investing together. They stand to reason: the less you pay for an investment the greater the return potential; just having one or two shares leaves you very exposed should the news turn bad regarding those shares but if you diversify across a range of shares you can reduce the risk of a fall in your overall portfolio; and doing the opposite to the crowd means you can avoid the points of maximum risk in markets when most are fully invested and take advantage of periods of maximum opportunity when most have sold.

“Success consists of going from failure to failure without loss of enthusiasm.” Winston Churchill

As with all things we need to recognise that to learn we need to make mistakes and to be persistent.

Balance

“A calm and modest life brings more happiness than the pursuit of success combined with constant restlessness” Albert Einstein

This applies to life in general, but it also applies to investing – don’t jump around all over the place and keep it simple.

“A man should make all he can, and give all he can.” Nelson Rockefeller

It’s not financially possible for everyone but consider giving a bit away for good causes if you can – and not just for the tax deduction as you will feel good and it will bring good karma.

“The trouble with doing nothing is that you don’t know when you have finished.” Cafe blackboard in Byron Bay

…so it’s always good to do something and investing is something worth doing (and worth doing well)!


Source: AMP Capital 17 May 2018

Important note: While every care has been taken in the preparation of this article, AMP Capital Investors Limited (ABN 59 001 777 591, AFSL 232497) and AMP Capital Funds Management Limited (ABN 15 159 557 721, AFSL 426455) makes no representations or warranties as to the accuracy or completeness of any statement in it including, without limitation, any forecasts. Past performance is not a reliable indicator of future performance. This article has been prepared for the purpose of providing general information, without taking account of any particular investor’s objectives, financial situation or needs. An investor should, before making any investment decisions, consider the appropriateness of the information in this article, and seek professional advice, having regard to the investor’s objectives, financial situation and needs. This article is solely for the use of the party to whom it is provided.


Will Australian interest rates ever go up?

While the global economy is seeing its fastest growth in years and the US Federal Reserve has increased rates five times since December 2015 and is on track for more hikes this year, the Reserve Bank of Australia (RBA) has now left interest rates on hold for a record 21 months in a row. The Australian economy is in a very different position to the US. While the RBA continues to expect that the next move in rates is most likely to be up, and we tend to agree, we now don’t see a hike until sometime in 2020. And the next move being a cut cannot be ruled out. This note looks at the reasons and what it means for mortgage rates, the $A and investors.

Four reasons why rates will be on hold into 2020

We have been looking for a rate hike in early 2019, but have now pushed that out to 2020 for the following reasons:

  • First, growth is likely to remain below RBA expectations. A bunch of factors will help keep the economy growing: the drag on growth from falling mining investment is largely over; non-mining investment is rising; infrastructure investment is booming; and net exports should add to growth helped by strong global conditions. However, against this housing construction is slowing and consumer spending is constrained with downside risks around slow wages growth, high debt levels and falling house prices in Sydney and Melbourne. Personal tax cuts likely to be tabled in the Budget will help keep the consumer going but are unlikely to offset all the drags. So while growth will likely improve from the 2.4% pace seen last year, it is likely to be to between 2.5% and 3%, below RBA expectations for a pick up to 3.25%.

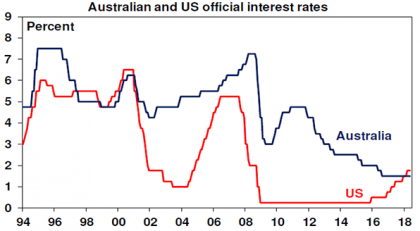
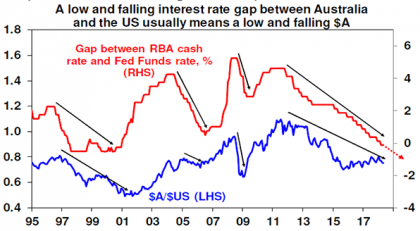
  • Second, wages growth and inflation are likely to remain low as growth is unlikely to be strong enough to eat into significant spare capacity in the Australian economy. Some say Australian rates just follow those in the US but there has been a big divergence in recent years. In 2009 while the Fed left rates near zero the RBA started raising rates only to start cutting them from 2011. And while the Fed started hiking rates in 2015 we continued cutting them in 2016. 


Source: Bloomberg, AMP Capital

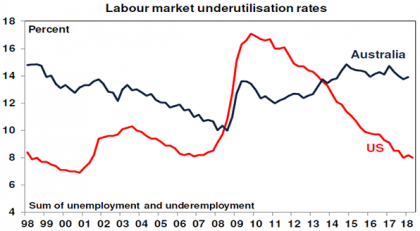
There is good reason for the RBA to lag the Fed. Labour market underutilisation (see next chart) at 8% in the US is about as low as it ever gets whereas in Australia its around 14%. If wages growth is only just starting to pick up in the US despite a much tighter labour market it’s no surprise that it will take much longer in Australia.


Source: Bloomberg, AMP Capital

Continuing weak wages growth along with excess capacity and high levels of competition in goods markets will keep underlying inflation around the low end of the RBA’s 2-3% target for a lengthy period yet.

  • Third, bank lending standards are going through yet another round of tightening as the household debt boom comes to an end, doing the RBA’s work for it. Now it relates to policies and practices around borrowers’ income, expenses and total debt levels. This has been driven by APRA which is shifting away from blunter constraints on lending to certain categories of borrowers (such as the 10% speed limit on credit growth to property investors) and is receiving added impetus now. This will particularly hit lower income borrowers and high home price to income markets like Sydney and Melbourne. Tougher checking of income and expenses and constraints in terms of the amount of loans going to high total debt to income borrowers will likely lead to a slowing in credit growth in the months ahead. While a credit crunch is unlikely its hard to reliably predict the impact of tighter lending standards.

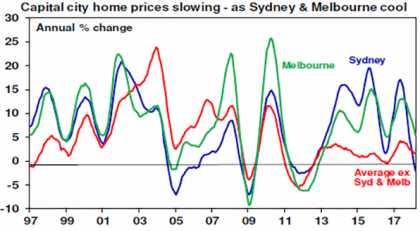
  • Finally, house prices are slowing led by falling prices in Sydney and Melbourne with more weakness likely. APRA measures to constrain investor and interest only borrowers have worked. These measures, combined with poor affordability, rising unit supply, falling expectations for price growth and the end of FOMO (fear of missing out) are pushing prices down. The latest round of tighter lending standards will add to this, as will any move to lower immigration levels (and curtail negative gearing and the capital gains tax discount were there to be change in government). 


Source: Domain, AMP Capital

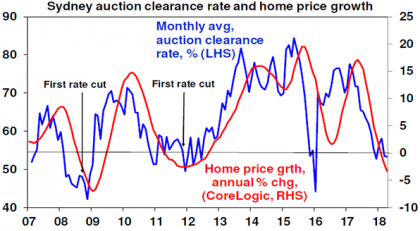
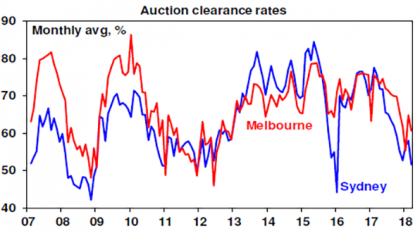
Capital cities other than Sydney and Melbourne face a much better outlook as they did not see the same boom in recent years. However, we see prices in Sydney and Melbourne falling another 5% this year, another 5% next year and with further slight falls in 2020. We are running around levels for price growth and auction clearance rates that in the past have been associated with the start of interest rate cutting cycles (in September 2008 and November 2011 – see the previous chart), not rate hikes! The risks of a sharper fall in prices if investors lose faith, homeowners decide to reduce high debt levels and if the shift from interest only to principle and interest for many borrowers over the next few years creates problems needs to be allowed for. Raising rates when prices are falling will accentuate these risks.

As a result of these considerations, we have pushed our timing regarding the start of interest rate increases into 2020. Of course, the risk here is that by 2020 the US economy may be weakening making it hard for the RBA to then start considering rate hikes. And of course, if the declines in home prices turn out to be deeper the next move could end up being a cut.

Won’t mortgage rates rise anyway?

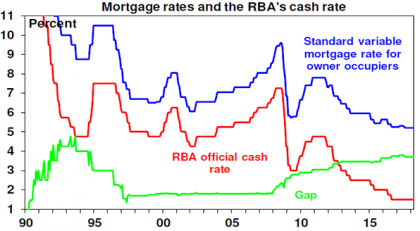
Since the time of the GFC “out of cycle” changes in bank mortgage rates have been common. However, the main driver of significant changes in mortgage rates remains what the RBA does with the cash rate – see the next chart. It cut from 2008 and mortgage rates fell. It hiked from October 2009 and mortgage rates rose. It cut from November 2011 and so mortgage rates fell. This makes sense as the banks get around 65% of their funding from bank deposits the main driver of which is the cash rate. However, the remaining 35% can cause some variation as will regulatory changes which saw higher rates for investors and interest only borrowers recently.


Source: RBA, AMP Capital

There are two main pressures at present. The first is a rise in money market funding costs in the US and Australia of around 0.3 to 0.4%. Given that only 10-15% of bank funding comes from this source its unlikely to have much impact. And the banks are unlikely to pass on the extra costs to owner occupiers on traditional loans given the Royal Commission, but banks could raise rates for investors and interest only borrowers. Higher US bond yields could also place some pressure on bank funding costs but again this is likely to be modest, and probably unlikely to result in higher rates for owner occupiers on traditional loans. The main thing for traditional borrowers to watch is the cash rate. If we are right, such borrowers will see pretty stable mortgage rates out to 2020.

What about the $A?

With the RBA likely on hold and the Fed set to keep hiking the interest rate gap between Australia and the US will go further into negative territory. Historically, this means a fall in the value of the Australian dollar. The $A appears to be starting to break below the rising trend channel that’s been in place since 2015 and we see more downside to around $US0.70. A fall to below $US0.50 as we saw in 2001 is unlikely as commodity prices are likely to remain much stronger than they were then.


Source: Bloomberg, AMP Capital

Implications for investors

First, bank deposits are likely to continue providing poor returns for investors for a while yet.

Second, as a result assets that are well diversified and provide decent income flow remain worthy of consideration. This includes unlisted commercial property and infrastructure along with Australian shares which continue to offer much higher income yields compared to bank deposits.

Third, Australian bonds are likely to outperform global bonds which are dominated by the US as US bond yields rise (on the back of Fed tightening) relative to Australian yields (which will be constrained by on hold RBA cash rates).
Finally, with the $A likely to fall further there is reason to keep a decent exposure to global assets on an unhedged basis.


Source: AMP Capital 3 May 2018

Important note: While every care has been taken in the preparation of this article, AMP Capital Investors Limited (ABN 59 001 777 591, AFSL 232497) and AMP Capital Funds Management Limited (ABN 15 159 557 721, AFSL 426455) makes no representations or warranties as to the accuracy or completeness of any statement in it including, without limitation, any forecasts. Past performance is not a reliable indicator of future performance. This article has been prepared for the purpose of providing general information, without taking account of any particular investor’s objectives, financial situation or needs. An investor should, before making any investment decisions, consider the appropriateness of the information in this article, and seek professional advice, having regard to the investor’s objectives, financial situation and needs. This article is solely for the use of the party to whom it is provided.
Australian capital city home prices fell 0.2% in March, their fifth monthly fall in a row. This has brought annual growth down to 0.8% from 11.4% in May last year. Most of the recent weakness relates to Sydney and to a less extent Melbourne.


Source: CoreLogic, AMP Capital

This is unusual in that property price downturns are usually preceded by significant interest rate increases. Consistent with the fall in Sydney and Melbourne property prices, auction clearance rates and home sales have also fallen.


Source: Domain, AMP Capital

How far will prices will drop? Will the weakness spread to other cities? And what will it mean for the broader economy?

Australia’s Achilles heel – the risk of a crash

With prices falling in Sydney and Melbourne some see this as the start of a crash. There is good reason to be concerned:
 

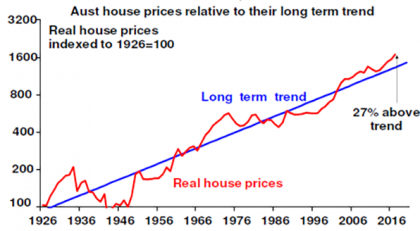
  • Real capital city house prices are 27% above their long-term trend (see the next chart) and are at the high end of OECD countries in terms of the ratio of prices to income and rents.


Source: ABS, AMP Capital

  • The surge in prices relative to income since the mid-1990s has gone hand in hand with a surge in the ratio of household debt to income that has taken it to the top end of OECD countries.

  • With a long period of strong prices and low mortgage rates has come some deterioration in lending standards with the share of new interest only loans reaching around 45% in 2015 and concerns about the reliability of borrowers’ income and living expense assessments when they take out loans.

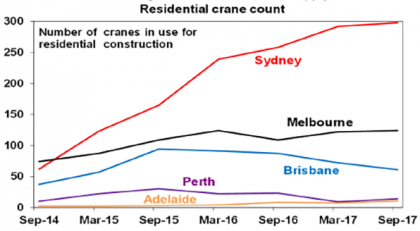
  • Finally, there has been a surge in the supply of apartments, notably in Sydney evident in the high number of residential cranes in use, raising concerns about oversupply.


Source: Rider, Levett, Bucknall Crane Index, AMP Capital

However, a crash remains unlikely

While crash calls and stories of mortgage stress are common, they have been repeated endlessly over the last 15 years. But, a crash (say a 20% national average price fall) remains unlikely:

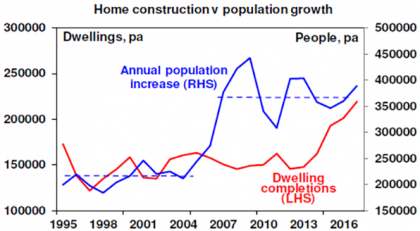
First, the real driver of high home prices and their persistence has been that, thanks to tight development controls and lagging infrastructure, the supply of dwellings has not kept pace with population driven demand.  Over the last decade annual population growth has averaged about 150,000 above what it was over the decade to the mid-2000s, which would require roughly an extra 50,000 new homes per year. But it’s only recently that supply has caught up with the pick-up in population growth. And population growth remains very strong.


Source: ABS, AMP Capital

Consistent with this average capital city vacancy rates are at or below their long-term averages, notably in Sydney.

Secondly, while mortgage stress is a risk: there has been a sharp reduction in interest only loans since APRA strengthened lending standards; debt servicing payments as a share of income have actually fallen slightly over the last decade and Census data shows that the share of owner occupier households with a mortgage for which debt servicing is above 30% of income has fallen from 28% in 2011 to around 20%; a significant number of households with a mortgage are ahead on their repayments; and banks non-performing loans remain low. While there has been some deterioration in lending standards it does not appear to be anything like that seen with NINJA (no income, no job, no assets) loans in the US prior to the GFC.

Finally, it is dangerous to generalise. Property prices have surged in Sydney and Melbourne but have fallen in Perth and Darwin and have seen only moderate growth in other capitals.

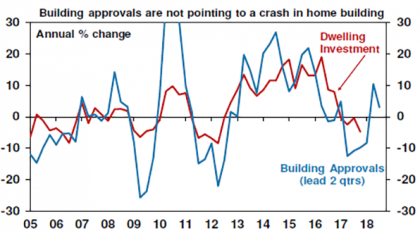
To see a property crash we probably need much higher interest rates or unemployment (neither of which are expected) or a continuation of recent high construction for several years (which is unlikely as approvals have cooled from their 2016 highs).

Outlook

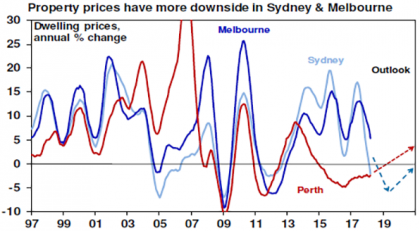
A further tightening in lending standards as banks get tougher on borrowers’ income and living expense levels along with rising supply and more realistic capital growth expectations by home buyers will see Sydney and Melbourne property prices fall another 5% or so this year with further falls likely next year.


Source: CoreLogic, AMP Capital

By contrast home prices in Perth and Darwin are either at or close to the bottom, price growth is likely to be moderate in Adelaide and Canberra, but it may pick up a bit in Brisbane thanks to stronger population growth and the boom in Hobart has a way to go yet.

Regional centres are likely to provide relatively faster capital growth reflecting weaker supply and offering more attractive rental yields (around 1.5 percentage points higher than in cities). Units are at greater risk given surging supply, but so far house prices have slowed more in Sydney and Melbourne.

The property cycle and the economy

A slowdown in the housing cycle can affect the broader economy via slowing dwelling construction, negative wealth effects on consumer spending and via the banks if mortgage defaults rise. However, as things currently stand the drag from housing construction is likely to be minimal – building approvals don’t point to a collapse in new construction (see the next chart) and it looks like alterations and additions will rise, negative wealth effects will weigh on consumers but not dramatically if we are right, and in the absence of a property price crash the impact on the banks will be manageable. Finally, other sectors of the economy are taking over from housing, eg business investment and state capital works, as being growth drivers.


Source: ABS, AMP Capital

Implications for investors

There are several implications for investors:

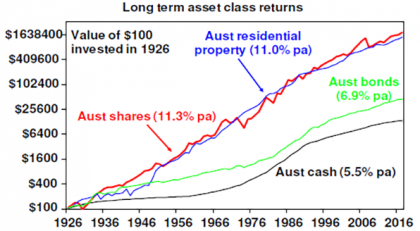
  • Firstly, over the very long term residential property adjusted for costs has had a similar return to Australian shares (see next chart). Its low correlation with shares, lower volatility but lower liquidity makes it a good portfolio diversifier. So, there is clearly a role for property in investors’ portfolios.


Source: ABS, REIA, Global Financial Data, AMP Capital

  • Secondly, there remains a case to be cautious regarding housing as an investment destination for now. It is expensive on all metrics and offers very low income (rental) yields compared to other growth assets. This means a housing investor is more dependent on capital growth.

  • Thirdly, these comments refer to Australian housing overall but it’s dangerous to generalise. Other cities and regional property are far more attractive than Sydney & Melbourne.

Source: AMP Capital 9 April 2018

Important note: While every care has been taken in the preparation of this article, AMP Capital Investors Limited (ABN 59 001 777 591, AFSL 232497) and AMP Capital Funds Management Limited (ABN 15 159 557 721, AFSL 426455) makes no representations or warranties as to the accuracy or completeness of any statement in it including, without limitation, any forecasts. Past performance is not a reliable indicator of future performance. This article has been prepared for the purpose of providing general information, without taking account of any particular investor’s objectives, financial situation or needs. An investor should, before making any investment decisions, consider the appropriateness of the information in this article, and seek professional advice, having regard to the investor’s objectives, financial situation and needs. This article is solely for the use of the party to whom it is provided.
It is about now when those well-intentioned New Year resolutions start to come under pressure.


The summer holidays are behind us, schools are back and the rhythm of life is returning to a familiar routine.

The bigger, bolder ambitions for the New Year are often the first to fall by the wayside simply because of the level of difficulty.

But instead of thinking big and bold what would the impact be of making a small change. Nothing radical, more of an adjustment than a rewrite of your lifestyle.

It is probably safe to assume that not too many people had retirement planning on their New Year resolution list. But it is definitely an area where small changes – depending on your age – can make big differences.

Our superannuation system mandates that 9.5 per cent of wages is paid into superannuation. But that is already slated to rise (albeit slowly) to 12 per cent by 2025. So is 9.5 per cent enough or should you be saving 12 per cent given that is the longer-term goal the government has settled on.

Or should you be listening to the actuarial professionals who point to 15 per cent of wages being the more reliable answer to the question of how much is enough?

Lifting your super contributions from 9.5 per cent to 15 per cent probably sits under the heading of bold, aspirational target for many people.

Today’s imperative – putting food on the table, paying energy bills – rightfully takes priority.

But what about if you shifted the dial on your super contributions just a little – say half of one per cent – to 10 per cent a year. And committed to increase by the same amount each year until you hit the 12 per cent target.

Using the retirement calculator on the financial services regulator ASIC’s Moneysmart website gives you an easy insight into adjusting your contributions. For a 30-year old earning $70,000 today the super account balance (in today’s dollars) is projected to be $276,000 at age 67 when contributing the mandatory 9.5 per cent.

If you increase your contributions to 10 per cent your account balance will go up by $12,200. If you take the bigger step of going to 12 per cent contributions the account balance is projected to rise to $337,700 – or $60,700 more to spend in retirement.

Context is important motivation here. As investors inertia and procrastination are two behaviours that typically work against us. Yet a modest increase in contribution level – perhaps a $100 or $200 a month – can make a significant difference over the long term and by dialling up your salary sacrifice contributions via payroll deduction is an effective way of harnessing the inertia and letting time and markets work for you.

Please contact us on Phone: 07 5641 4134 for assistance .

Before we know it will be time for setting next year’s New Year resolutions.

 Source : Vanguard February 2018 

Written by Robin Bowerman, Head of Market Strategy and Communications at Vanguard.


Reproduced with permission of Vanguard Investments Australia Ltd

Vanguard Investments Australia Ltd (ABN 72 072 881 086 / AFS Licence 227263) is the product issuer. We have not taken yours and your clients’ circumstances into account when preparing this material so it may not be applicable to the particular situation you are considering. You should consider your circumstances and our Product Disclosure Statement (PDS) or Prospectus before making any investment decision. You can access our PDS or Prospectus online or by calling us. This material was prepared in good faith and we accept no liability for any errors or omissions. Past performance is not an indication of future performance.

© 2018 Vanguard Investments Australia Ltd. All rights reserved.

Important:
Any information provided by the author detailed above is separate and external to our business and our Licensee. Neither our business, nor our Licensee take any responsibility for any action or any service provided by the author.

Any links have been provided with permission for information purposes only and will take you to external websites, which are not connected to our company in any way. Note: Our company does not endorse and is not responsible for the accuracy of the contents/information contained within the linked site(s) accessible from this page.


There is quite a lot of talk about volatility coming back to share markets all of a sudden, and with the talk there’s also bit of conjecture about where the volatility originates from.

Some say it’s because interest rates and bond yields are beginning to rise; others will point to the end of quantitative easing in the United States and elsewhere for the bumpier ride.

The return of inflation has been mentioned quite a lot recently as a reason why share markets are jumpy all of a sudden, by what has the return of inflation in the United States really got to do with share market volatility?

The link between share market volatility and inflation has to do with the recalibration investors are making to their expectation of share market performance, according to Dr Shane Oliver, AMP Capital’s Chief Economist.

The reason we have the volatility is simple, Oliver says:

“Investors have been used to low volatility for so long, low inflation, low interest rates low bond yields and that was factored into many investment markets share markets. Now we are moving into a world of possibly higher inflation, higher interest rates, investors have to reprice and adjust their expectations,” Oliver explains in this interview with AMP Capital TV.

Further, there’s a bit of a battle of the “bulls and the bears” taking place at the moment, Oliver adds, pointing out that some market watchers and investors see an uptick in inflation in the United States as a good thing, while other investors are focusing on the negative impact of the transition that’s taking place at the moment.

“If interest rates go up, bond yields go up, that makes share markets a little less attractive compared to bonds and cash at the margin, and investors need to make that adjustment,” Oliver notes, explaining the rational for the dips we’ve seen in markets this year.

Share markets dropped over two consecutive days locally in early February, led by even steeper falls over seas, before recovering their losses towards the end of the month.

Meanwhile, there’s a silver lining for the more optimistic share markets watchers, Oliver adds.

From higher inflation and higher interest rates, you’re also getting potentially higher profits growth, he says.

“An uptick in inflation is not a bad thing, but investors have to adjust their expectations and that’s what’s causing the volatility,” he says.


Source: AMP Capital 12 March2018

Important note: While every care has been taken in the preparation of this article, AMP Capital Investors Limited (ABN 59 001 777 591, AFSL 232497) and AMP Capital Funds Management Limited (ABN 15 159 557 721, AFSL 426455) makes no representations or warranties as to the accuracy or completeness of any statement in it including, without limitation, any forecasts. Past performance is not a reliable indicator of future performance. This article has been prepared for the purpose of providing general information, without taking account of any particular investor’s objectives, financial situation or needs. An investor should, before making any investment decisions, consider the appropriateness of the information in this article, and seek professional advice, having regard to the investor’s objectives, financial situation and needs. This article is solely for the use of the party to whom it is provided.
James Maydew, AMP Capital’s Global Head of Listed Real Estate, leverages his global view to bring a regular insight to property value trends from around the world.


Key Points 

Residential house prices in a few global cities have soared because of:
     ​​
•​ Concentration of business activity
     
•​ Low global interest rates

But these are now starting to soften thanks to:
     
• Government policy
     
•​ Rising interest rates

However Singapore has actually seen residential price FALLS in recent years

But prices in Singapore are now set to rise due to:
     
•​ Government easing its affordability measures
     
•​ The Singapore economy now growing strongly

We feel that this represents an attractive opportunity for investors to explore

 
The concentration of business activity in a handful of global cities and easy liquidity from central banks has led to phenomenal residential price growth over the last eight years. Valuations have soared in global cities from Shanghai to Stockholm as well as the most global of all; New York and London.


Fueled by cheap money, the almost parabolic rise experienced in these cities has raised fears that certain markets may be close to rolling over. Some of these such as London and Vancouver are already starting to soften as the deathly combination of government intervention and rising interest rates begins to have an impact.

However; there is one gateway market that is an exception to this trend, and moreover its economy is starting to rebound at the same time – Singapore.

The city state not only missed the same residential price explosion but amazingly saw a decline in house prices over this same period of excess central bank liquidity.

We believe that Singapore residential values are now in the early phase of a multiyear recovery trend following the easing of the two major headwinds that have held back the market since 2013 and a better balance between supply and demand.

Firstly, the government (through the Monetary Authority of Singapore – MAS) has eased some of its macro prudential measures, implemented to curtail both speculation and to support affordability in the housing market.

Secondly and most importantly, the domestic economy is now looking far more robust than it has for many years, with household balance sheets at their strongest position in twenty years. We think this creates a fantastic opportunity for residential developers in Singapore that have been sitting on sizeable land banks and are now pushing inventory into a rising market.

Beginning in 2009, Singapore introduced a series of restrictions on buying, selling and financing residential property. This came as the government became concerned about housing affordability for citizens as cheap money from central banks flooded into Singapore’s open economy to finance real estate investment.

Buyers’ stamp duty was set at 15 per cent, a level that has successfully deterred most foreign investors and speculation has been discouraged with a 16 per cent sellers’ stamp duty on sales made within a year of purchase. The policy certainly had the desired effect, since 2013 the residential market has fallen by 12 per cent over 15 consecutive quarters, the longest losing run in the 40 years that Singapore has compiled such data.

However, in 2017 the Singapore Government announced that it would unwind some of these measures. Home prices had fallen substantially and the government was concerned about the impact of this on the country’s three main banks. In short, as competing global cities around the world had seen house prices hit the stratosphere and affordability hit the floor, Singapore was moving in the opposite direction.

Sellers’ stamp duty will now only be payable on sales within three years of purchase, rather than four, and the stamp duty rate is being reduced. It was also announced that rules regarding debt servicing ratios for some mortgagees would be relaxed.

The Singapore residential market’s other headwind was the weakness of its domestic economy stretching back to 2012. It has suffered from weak external demand and subdued consumer spending during this time.

However, signs are now emerging that Singapore is finally starting to motor again, with improvements in the services economy potentially providing a further boost. This is being driven by growth in export-orientated high value industries such as health care, information technology, communications and higher education. This led to the Singapore economy growing by 5.4 per cent year-on-year in the third quarter 2017, the fastest growth in four years.

This in turn is boosting fundamentals in the housing market as net wealth improves – driving greater confidence, increasing transactions and falling levels of unsold inventory, with supply being further reduced by the demolition of older condominium blocks in what are known as en bloc sales. Residential developers are in fact holding inventory releases back, very likely because they see greater value tomorrow than they do today, at a time where we are at a decade low in unsold residential stock.

Sustainable economic growth and a relaxation of government controls are the keys to a recovery in the Singapore housing market. These conditions have been met and we appear to be at an inflexion point at the same moment in time as other residential markets are ending their multiyear bull runs. The relative price attraction of Singapore residential property compared to other world cities is driving investor demand and multiple expansion in those residential developers that are listed companies, as the growth realisation begins to get priced in.

We think that solid housing market fundamentals in a developed Asian economy with protected property rights and an attractive lifestyle represent an attractive opportunity that some investors are now eager to explore.


Source: AMP Capital 9 March 2018

Author: James Maydew, AMP Capital’s Global Head of Listed Real Estate

Important note: While every care has been taken in the preparation of this article, AMP Capital Investors Limited (ABN 59 001 777 591, AFSL 232497) and AMP Capital Funds Management Limited (ABN 15 159 557 721, AFSL 426455) makes no representations or warranties as to the accuracy or completeness of any statement in it including, without limitation, any forecasts. Past performance is not a reliable indicator of future performance. This article has been prepared for the purpose of providing general information, without taking account of any particular investor’s objectives, financial situation or needs. An investor should, before making any investment decisions, consider the appropriateness of the information in this article, and seek professional advice, having regard to the investor’s objectives, financial situation and needs. This article is solely for the use of the party to whom it is provided.
The infrastructure industry is evolving rapidly worldwide and specialist investment firms are taking bold steps to be ahead of the changes.


Smart investors have long recognised the infrastructure sector’s relative stability and reliable growth potential, and therefore its quality as an asset class. Yet the infrastructure environment has changed radically in recent decades and this presents challenges the industry must respond to. “Infrastructure is a much more complex place to invest than it was 20 years ago,” explains Boe Pahari, managing partner and global head of infrastructure at AMP Capital, an investment firm with tens of billions of dollars placed in the industry.

“Every asset class goes through a process of maturation and that’s certainly happened in infrastructure investing. As you acquire new assets and generate returns for investors through active management, the assets are derisked and over time move from privatisation to direct investors,” he says.

“The cycle is repeated as the asset class continues to evolve with new categories of risk. This means you need the right sector expertise to respond to the changing pace of infrastructure as it continues to rep- resent essential assets and services in contemporary urban living.”

There are four distinct causes of continued disruption in the infrastructure space, globalisation, urbanisation, digitisation and demographics.

Globalisation has meant a huge surge in the use of air travel, particularly in emerging markets, as well as strong demand for the creation of regional airport hubs, which in many cases are now also created as large- scale retail and commercial real estate destinations. Train services have also seen increased demand, bolstered by environmental awareness.

Meanwhile, urbanisation has resulted in significant shifts in demand for industrial-scale energy storage and localised power generation. In essence, with cities seeing their number of inhabitants swell year on year, energy demands are increasing and supplies need to be managed in the most economically and environmentally viable ways.

At the same time, the trend towards digitisation is strong, and demand is relentless for services based on fibre-optic and wireless connectivity. “Across the world, bandwidth has increased forty five times in the last ten years. The impact has been enormous on infrastructure, in terms of telecoms towers and mobile technology,” Mr Pahari says.

Meanwhile, global demographic changes are extensive, including quickly ageing populations in many countries. “By 2035, around 20 per cent of the population of the world will be 65 or older,” Mr Pahari explains. “That represents a significant burden of responsibility for the public sector to look after the more senior sections of its populations.”

It is also important to remember that with governments across the globe burdened with high levels of debt, fewer infrastructure projects are being publicly funded. Private capital is stepping in.

All these changes mean a significant new world for investors. Asset allocation is shifting increasingly towards platforms and away from more traditional core infrastructure. Taking the emergence of Uber as an example of a broader trend, Mr Pahari says that for infrastructure investors, the value is moving away from physical assets, such as taxi businesses, towards the digital platforms that underpin popular services. “Being part of the platform is the way we need to go forward,” he says.

Understanding such driving forces is critical for investors as they look to minimise risks and identify value, investing in both listed equity and private debt. In no small part, the challenge is to assess the fast-changing dynamics of infrastructure markets accurately to seize the opportunities, predict where they are going and invest with eyes open to the future.

AMP Capital’s “truly global” presence, with offices in Sydney, Delhi, Dubai, London, New York and Los Angeles, gives it a strong basis for get- ting as close as possible to a comprehensive appreciation of all the pertinent trends, Mr Pahari says.

But having a global network of offices is not enough for any investment man- ager. “The next thing you have to do is go out there, experience the changes yourself and spend time talking to people, trying to understand where the world is headed,” he notes. For investment management firms of the scale of AMP Capital, it is essential to be deeply entrenched in the infrastructure sector and offer real expertise to secure consistently correct decisions.

“The group of people we have working on our assets, from origination to management to board members to governance, is highly extensive, it’s comprehensive and their ideas are very carefully thought through,” says Mr Pahari. “Investors rely on this, so we pay close attention to building and retaining our expert skills base.”

By doing so, the company can aim to bring “genuine sector expertise into sharp focus in all these different locations and environments”, he says. Underlying all that, though, Mr Pahari insists: “You need to value your own people and listen to them very carefully. They’re out there in the markets listening and coming back to you with myriad ideas about opportunities and potential threats.”

AMP Capital is extensively invested in the major areas of disruption, from its presence in local airports, such as Newcastle and Leeds Bradford, to local power, wireless connectivity, and the provision of care for elderly people.

But even an operation with the scale and local presence of AMP Capital cannot sit back and expect routinely to predict the future. “Being ready for what lies ahead, against a backdrop of profound and constant change, is a challenge we always need to rise to,” says Mr Pahari. “The only response is to be fully embedded in the infra- structure industry, to see the changes coming, and to have the skills to respond and invest well.”

Source: AMP Capital 8 March 2018

Author: Boe Pahari, Managing partner and global head of infrastructure equity

As originally see in the ‘Future of Infrastructure’ report published in The Times on 15th February 2018.

Important note: While every care has been taken in the preparation of this article, AMP Capital Investors Limited (ABN 59 001 777 591, AFSL 232497) and AMP Capital Funds Management Limited (ABN 15 159 557 721, AFSL 426455) makes no representations or warranties as to the accuracy or completeness of any statement in it including, without limitation, any forecasts. Past performance is not a reliable indicator of future performance. This article has been prepared for the purpose of providing general information, without taking account of any particular investor’s objectives, financial situation or needs. An investor should, before making any investment decisions, consider the appropriateness of the information in this article, and seek professional advice, having regard to the investor’s objectives, financial situation and needs. This article is solely for the use of the party to whom it is provided.