Refinancing your assets to renovate a property is a significant decision that will hopefully improve your standard of living or add substantial value to your property.

Refinancing isn’t as straightforward as you might expect. The type of renovation proposed goes a long way to dictating the loan required. If the wrong loan is chosen, you could be left with a pile of unexpected debt.

 

Know your budget

Before considering refinancing, you need to have a clear idea of your budget.

If you underestimate your budget, you run the risk of getting knocked back from your lender, according to an MFAA accredited finance broker.

“I know a lot of homeowners who have estimated a budget of say $100,000 to do renovations, only to discover it will cost a lot more,” the broker says.

“This means you may have to reapply for the loan, which banks generally don’t like.”

“Be conservative with your projection. If you think you need $100,000, I’d recommend to apply for $150,000 just in case, if you can afford it. The key is stick to your budget,” adds the broker. 

The next step is to speak to your broker to determine which loan will suit your needs and objectives.

Line of credit loan (Home equity loan)

Also known as an equity loan, to be eligible, one must be looking to make upgrades to the cosmetic domain of their property. 

Installing a new bathroom or kitchen, painting the interior or exterior of the house and other basic construction falls under a line of credit loan.

These renovations, more often than not, do not supersede the costs of structural changes, so homeowners can call on up to 80 per cent of their Loan-to-Value Ratio (LVR).

A line of credit loan is a “revolving door” of credit that combines your home loan, daily spending and savings into one loan.

To calculate the value you can borrow, subtract your current loan balance from your property value and then multiply by 80 per cent. For example, if your property is worth $500,000, and you have $250,000 left on your loan, your home equity is $250,000. You then multiply this total by 80 per cent. If you’re uncertain of your home value, contact an MFAA Accredited Finance Broker who can assist you to arrange for an appraisal or valuation. For MFAA calculators, click here.

If you choose a line of credit home loan, it essentially works as a large credit card. You can use it to purchase cars, cosmetic renovations and other investments. However, the interest-only charge starts when the equity is drawn down.

Keep in mind, line of credit loans provide you with money that can gather interest quickly, so if you are ill disciplined with repayments or money, speak to us on Phone: 07 5641 4134 for a plan matches your unique circumstances.

Construction loans

Construction loans are suitable for structural work in your home, for example, if you’re adding a new room or making changes to the roof.

Construction loans give homeowners the opportunity to access larger sums of money, with the amount dependent upon the expected value of the property after renovations are completed.

The advantage of a construction loan is that the interest is calculated on the outstanding amount, not the maximum amount borrowed. This means you have more money available in your kitty, but only pay interest on the money you choose to spend. For this reason, the broker may recommend that you apply for just one loan, but leave some leeway in your borrowed kitty.

When applying for a construction loan, council approval and a fixed price-building contract are required.

Your lender will appoint an assessor to value your construction at each stage of the renovation. This will happen before you pay your instalment. When construction is complete, speak to your mortgage broker as you may be able to refinance back to the loan of your choice.

When looking at both these loans, the broker says consumers can call on other property they own to boost their overall borrowing amount if they wish. 

“Depending on the client, they can use other property to get a line of credit and a construction loan. Or they might get a typical construction loan if there is going to be an extensive framework change on the building,” the broker says.

Broker advice

If you speak to a broker they will be able to determine which loan will give you the options you seek.  This advice is essential, as a poorly planned construction loan could cost you more down the road.

“Consumers should ask their broker, ‘What type of loan am I eligible for?’, because if you don’t get your construction loan right, you may be jeopardising your bank security,” the broker says.

While these specific options can be discussed with your broker, if they aren’t suitable, there may be other options available to you. Speak to us on Phone: 07 5641 4134 to make your grand renovation plans a reality.

For further information or assistance please contact us on Phone: 07 5641 4134

Source :MFFA 

Reproduced with the permission of the Mortgage and Finance Association of Australia (MFAA)

Important note: This provides general information and hasn’t taken your circumstances into account. It’s important to consider your particular circumstances before deciding what’s right for you. Although the information is from sources considered reliable, we do not guarantee that it is accurate or complete. You should not rely upon it and should seek qualified advice before making any investment decision. Except where liability under any statute cannot be excluded, we do not accept any liability (whether under contract, tort or otherwise) for any resulting loss or damage of the reader or any other person.

Any information provided by MFAA detailed above is separate and external to our business and our Licensee. Neither our business, nor our Licensee take any responsibility for their action or any service they provide.

Any links have been provided with permission for information purposes only and will take you to external websites, which are not connected to our company in any way. Note: Our company does not endorse and is not responsible for the accuracy of the contents/information contained within the linked site(s) accessible from this page.


There are millions of Australians providing care to an older person or someone with a disability or long term health condition. Looking after ageing parents or unwell family members and friends can be very emotional and stressful. Your day to day routine could change dramatically. It’s important to look after yourself and keep an eye on your finances.

Take care of yourself

Be kind to yourself and make sure you seek support from family and friends. Each state and territory has a carer’s association that provides advice and support:

Consider getting emotional support from a professional. Your local GP can recommend someone for you to talk to. If you are receiving Centrelink payments, find out about the Department of Human Services’ social work services – phone 13 17 94.

You can also contact:

You can also contact Kildonan Uniting Care who offer a financial counselling for families with children and young people living with cancer through their WeCare service.

Make sure you’re getting what you’re entitled to

Government assistance

If you’re unable to work because you are caring for someone, you may be entitled to a government payment. Check with the Department of Human Services by completing the payment finder to see what you are entitled to.

From your employer

Check with your employer to find out how much paid carer’s leave you are entitled to. To find out more about your rights at work see the Fair Work Ombudsman’s Sick and carers leave information.

Adjust to a change in income

Becoming a carer might mean you have to cut back your hours in paid work, or leave altogether. If this is the case you will need to adjust to a change in income. Once you know exactly how much money you are entitled to and your total income, work out how you will use this to cover your expenses. The best way to do this is by doing a budget so you can see how much is coming in and how much is going out.

Work out how working part-time or taking a break from paid work due to carer responsibilities affects your super in retirement.

Retirement planner

Ask for a hardship variation to your bills and debts

If you are finding it hard to pay bills, credit cards or loan repayments, the first step is to talk with your lender or finance provider and let them know you are experiencing financial hardship.

Many companies have hardship officers who can assess your situation and work out what help is available. Hardship officers can also help you work out an affordable payment plan such as paying bills in instalments or temporarily altering your loan repayments. See our information on financial hardship.

Seek help from a financial counsellor

Free, independent and confidential counselling services are available through Financial Counselling Australia. Financial counsellors can help you negotiate payments and apply for a hardship variation. Find a financial counsellor near you.

Keep an eye on your super

If you’re earning less money from paid work your super balance will be affected. If you can afford it, see if you can contribute to your super while you are not working.

Make sure your super is working well for you by consolidating any super accounts you aren’t using, checking your super fund is right for you and ensuring your super investment option suits you. For more information see if your super is on target.


Case study: Margaret seeks help

Margaret is 58 and recently divorced from her husband of 30 years. She works part-time at a local library. Her mother and father are in their 80s. Margaret’s mother has a degenerative brain disease which means she is unable to do much for herself anymore.



Because Margaret lives the closest of all of her siblings, the amount of time she spends cooking, cleaning and looking after her mother is increasing dramatically. Margaret has had to reduce her hours at the library to only fifteen hours per week.

On the advice of a friend, she met with a financial counsellor who is helping her work out the best way to make sure her income covers all her expenses.

Being a carer for a family member or friend who is unwell is a very courageous thing to do. It’s important you also think about your own wellbeing and make sure your finances are under control.


Source:
Reproduced with the permission of ASIC’s MoneySmart Team. This article was originally published at www.moneysmart.gov.au

Important note: This provides general information and hasn’t taken your circumstances into account.  It’s important to consider your particular circumstances before deciding what’s right for you. Although the information is from sources considered reliable, we do not guarantee that it is accurate or complete. You should not rely upon it and should seek qualified advice before making any investment decision. Except where liability under any statute cannot be excluded, we do not accept any liability (whether under contract, tort or otherwise) for any resulting loss or damage of the reader or any other person.  Past performance is not a reliable guide to future returns.

Important:
Any information provided by the author detailed above is separate and external to our business and our Licensee. Neither our business, nor our Licensee take any responsibility for their action or any service they provide.

Any links have been provided with permission for information purposes only and will take you to external websites, which are not connected to our company in any way. Note: Our company does not endorse and is not responsible for the accuracy of the contents/information contained within the linked site(s) accessible from this page.

If you make voluntary super contributions through a salary sacrifice agreement you should be aware of how your contributions will affect your super balance. You can agree with your employer for your voluntary contribution to be in addition to your employer’s compulsory super contribution.

If you are deciding whether you should salary sacrifice some of your income into your super or you are already salary sacrificing, you may want to find more information or check your entitlements under the Fair Work Act 2009.

One example of a salary sacrifice arrangement is to have some of your salary or wages paid into your super fund instead of to you.

Salary sacrificed super contributions are classified as employer super contributions, rather than employee contributions. This reduces the amount of super guarantee contributions that your employer is required to make for you, unless the terms of the agreement between you and your employer specify that they continue to pay the minimum super guarantee amount. If you make super contributions through a salary sacrifice agreement, these contributions are taxed in the super fund at a maximum rate of 15%. Generally, this tax rate is less than your marginal tax rate.

The sacrificed component of your total salary package is not counted as assessable income for tax purposes. This means that it is not subject to pay as you go (PAYG) withholding tax.

If salary sacrificed super contributions are made to a complying super fund, the sacrificed amount is not considered a fringe benefit.

The Fair Work Commission regulates employment agreements and conditions. To check your conditions contact Fair Work Commission.

The Fair Work Ombudsman has information on deducting pay & overpayments. You can contact the Fair Work Ombudsman on 13 13 94.

See also:

Salary sacrifice limitations

If there are no limitations specified in the terms of your employment, there is no limit to the amount you can salary sacrifice. However, you should also consider whether the:

  • additional salary you wish to sacrifice will cause you to exceed your concessional (before-tax) contributions cap and attract additional tax – this cap limits the amounts that can be contributed to your super fund and still receive the concessional tax rate of 15%

  • salary amount you sacrifice will attract Division 293 tax – this occurs when you have an income and concessional super contributions of more than

    • $300,000 in one year, before 1 July 2017

    • $250,000 in one year, from 1 July 2017.

For further assistance or information please contact us on Phone: 07 5641 4134 

Source:

Reproduced with the permission of the Australian Tax Office. This article was originally published on https://www.ato.gov.au/Individuals/Super/Growing-your-super/Adding-to-my-super/Salary-sacrificing-super/

Important:
This provides general information and hasn’t taken your circumstances into account.  It’s important to consider your particular circumstances before deciding what’s right for you. Although the information is from sources considered reliable, we do not guarantee that it is accurate or complete. You should not rely upon it and should seek qualified advice before making any investment decision. Except where liability under any statute cannot be excluded, we do not accept any liability (whether under contract, tort or otherwise) for any resulting loss or damage of the reader or any other person. 

Any information provided by Australian Tax Office detailed above is separate and external to us and our Licensee. Neither we nor our Licensee take any responsibility for their action or any service they provide.

Any links have been provided with permission for information purposes only and will take you to external websites, which are not connected to our company in any way. Note: Our company does not endorse and is not responsible for the accuracy of the contents/information contained within the linked site(s) accessible from this page.

As the first quarter of 2017-18 draws to a close, it’s worth checking whether you are making the most of your ability to make regular salary-sacrificed super contributions.

If your salary-sacrificing contributions are lagging, think about stepping up your contributions for the remaining nine months of the financial year.

Your ability to step up your contributions – never overlooking the annual contributions cap – will much depend on your personal circumstances. There are, of course, two broad categories of super contributions – concessional (before-tax) contributions and non-concessional (after-tax) contributions, each with different annual contribution caps*.

If you are thinking of stepping-up your salary-sacrificed contributions, it is critical to keep in mind that the $25,000 annual concessional cap for 2017-18 applies to the total of the various types of concessional contributions, which include salary-sacrificed amounts.

Concessional contributions comprise compulsory (SG), salary-sacrificed and personally-deductible contributions (often made by the self-employed and investors).

Key changes affecting concessional contributions from 2017-18 include the lowering of the contributions cap to $25,000 for all members eligible to receive contributions. (The cap is down from a standard $30,000 or $35,000 if aged over 49).

And from 2017-18, the ability for individuals to claim tax deductions for personal contributions is broader and less rigid.

You may be eligible to claim deductions for your personal contributions if you are employed and earning a salary, self-employed, an investor or beneficiary of a trust.

The previous rule that you must not earn more than 10 per cent of your income from employment to claim deductions for personal contributions has been removed from 2017-18.

While these changes ease the rules on claiming deductions for super contributions, some members will need to keep a closer watch to ensure they don’t overshoot the concessional contributions cap.

Concessional contributions that exceed the cap are effectively taxed at an individual’s marginal tax rate (plus Medicare) and subject to an excess contributions charge for late tax.

It takes years to build up enough savings for a satisfactory standard of living in retirement. A smart strategy is to contribute as much as you can whenever you can – given your other commitments.

Are your salary-sacrificed contributions lagging?

* The annual contribution caps for 2017-18 are: $25,000 for concessional contributions; a standard $100,000 for non-concessional contributions (or $300,000 over three years).

Please contact us on Phone: 07 5641 4134 to discuss further .

Source : Vanguard 25 September 2017 

Written by Robin Bowerman, Head of Market Strategy and Communications at Vanguard.

Reproduced with permission of Vanguard Investments Australia Ltd

Vanguard Investments Australia Ltd (ABN 72 072 881 086 / AFS Licence 227263) is the product issuer. We have not taken yours and your clients’ circumstances into account when preparing this material so it may not be applicable to the particular situation you are considering. You should consider your circumstances and our Product Disclosure Statement (PDS) or Prospectus before making any investment decision. You can access our PDS or Prospectus online or by calling us. This material was prepared in good faith and we accept no liability for any errors or omissions. Past performance is not an indication of future performance. 

© 2017 Vanguard Investments Australia Ltd. All rights reserved.

Important: Any information provided by the author detailed above is separate and external to our business and our Licensee. Neither our business, nor our Licensee take any responsibility for their action or any service they provide. Any links have been provided with permission for information purposes only and will take you to external websites, which are not connected to our company in any way. Note: Our company does not endorse and is not responsible for the accuracy of the contents/information contained within the linked site(s) accessible from this page.


At the start of last year, with global and Australian shares down around 20% from their April/May 2015 highs, the big worry was that the global economy was going back into recession and that there will be another Global Financial Crisis (GFC). Now, with share markets having had a strong run higher, it seems to have been replaced by worries that a crash is around the corner and this will give us the global recession and new GFC that we missed last year!

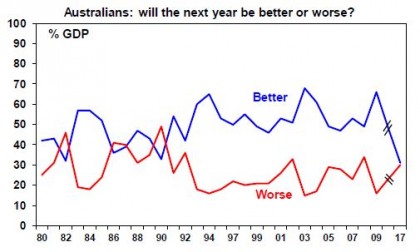
Australians seem particularly vulnerable to worries these days. On the weekend I read that Australians are suffering from an “epidemic of anxiety” and that out of a survey of 24 nations Australians ranked in the upper half in terms of worries about a health epidemic (9th highest), a terrorist attack (8th highest) and a nuclear attack (5th highest) – way above South Korea in terms of the latter despite Kim Jong-un’s new found nuclear capability just across the border! And a Roy Morgan survey has found that only 31% of surveyed Australians expect next year to be a better year than 2017, which is the lowest on record and only just above the 30% who expect next year to be worse. See the next chart.


No survey results for 1996, 2010-2016, Source: Roy Morgan, AMP Capital

In fact, it’s the lowest net balance of “better” less “worse” expectations for the year ahead since Australia was in the midst of the last recession in 1990. Whatever happened to the “she’ll be right” approach? Surely it’s not that bad!

At a broader global level, there seems to be a never ending worry list which since the GFC has rolled on through worries about a new collapse in the US (on the back of too much debt, hyperinflation on the back of money printing, deflation after the hyperinflation failed to materialise, a slump when monetary stimulus ends, or whatever), to worries the Eurozone will blow (or vote) itself apart, to worries that China will collapse as a result of too much debt and/or a property crash, interspersed by worries about the emerging world, Ebola, Ukraine, deflation, North Korea and various elections including the advent of President Trump along the way. And of course, the worries about Australia collapsing keep rolling on with the focus switching from a commodity crash to a housing crash.

Despite this ongoing worry list, investment returns have generally been good. Most assets have had good returns over the last year and the last five years, and balanced growth superannuation funds after fees and taxes returned an average 8.2% over the year to September and 9.3% per annum over the last five years.

So why the persistent gloom?

Some might argue that post the GFC, the world is now a more negative place and so gloominess is understandable today. But given the events of the last century – ranging from flu pandemics, the Great Depression, several major wars and revolutions, numerous recessions and financial panics – it’s doubtful that this is the case.

More fundamentally, it’s well known that humans are naturally attracted to bad news stories. The evolution of the human brain through the Pleistocene age where the trick was to dodge woolly mammoths and sabre toothed tigers means that much more space in our brains is devoted to threat than reward. This means that we are constantly on the lookout for risks and so more disposed to check out bad news stories as opposed to good news. In the investment world, an outcome of this is known as “loss aversion” in that a financial loss is felt far more keenly than a same-sized gain. As a result, doomsters are far more likely to be seen as deep thinkers than optimists and “bad news sells”.

But there is nothing new here. What has changed is the flow of information from a trickle to an avalanche. This is the case everywhere and the investment world is not immune. As the well-known US stock picker Peter Lynch observed “stock market news has gone from hard to find (in the 1970s and early 1980s), then easy to find (in the late 1980s), then hard to get away from”. This can be great in a way, but it can also just add to confusion.

But more significantly, the information age has led to not just greater access to information but also an explosion of media begging for attention. And in the scramble to get me and you to tune in, bad news and gloom beats good news and balance. I just have to swipe right (no, not Tinder!) on my smart phone to see an updated list of links to bad news stories and celebrity gossip (but rarely anything positive!).

Arguably, the political environment has added to this in some countries with politicians becoming more polarised to the left and the right and more willing to scare the electorate into supporting them.

Despite the improvement in the global economy over the last year, Google the words “the coming financial crisis” and you’ll still get 49.3 million search results including such gems as:

  • “The next financial crisis is coming ‘with a vengeance’.”

  • “The next financial crisis is coming, I just don’t know when.”

  • “Financial crisis coming by end 2018: Prepare urgently.”

  • “Trump can’t stop the next financial crisis.”

  • “It’s a scary time with a global crisis on the way.”

  • “Major crisis coming, bigger than 2008 financial crisis.”

And on and on.

Of course, people have always been making such predictions of imminent disaster – my favourite was Ravi Batra’s The Great Depression of 1990, which didn’t happen so it morphed into The Crash of the Millennium, which saw an inflationary depression that didn’t happen either.  It’s just that it’s now a lot easier and cheaper to access it and be scared by it.

So with all the talk of another global financial crisis and some sort of collapse in Australia, it’s not that surprising that people are apprehensive and Australians are less positive about the future. 

But the world is actually looking good

While all countries have their challenges, the global economy is in its best shape in years:

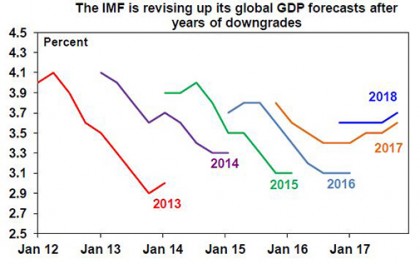
  • After years of downgrading its global growth forecasts, the IMF has been revising them up this year.


Source: IMF, AMP Capital

  • Global profits are up around 15% over the last year.

  • Unemployment has been falling virtually everywhere (except Japan where it’s just 2.8%!).

And while Australia could be doing a lot better and is not without its issues (notably around record low wages growth, high underemployment, expensive housing and high household debt), the economy has managed to keep growing despite the mining investment boom going bust and should benefit from stronger global growth and the end of the drag from falling mining investment. All of which should be able to keep it growing, albeit we don’t see strong enough growth or inflation for the RBA to start raising rates for a while yet.

The case for optimism as an investor

Dr Don Stammer – a doyen of Australian economists and investing – has said there are six things we owe our children or grandchildren: a sense of humour; a reasonable education; an early understanding of the magic of compounding; an awareness the cycle lives on; some help when they buy their first house or apartment; and a feeling of optimism. I completely agree.  I have written lots on the importance of compounding and the cycle but I think a degree of optimism is essential if you wish to succeed as an investor.

Benjamin Graham once said: “To be an investor you must be a believer in a better tomorrow.” If you don’t believe the bank will look after your term deposits, that most borrowers will pay back their debts, that most companies will see rising profits over time, that properties will earn rents etc then there is no point investing. This is flippant but true – to be a successful investor you need a favourable view of the future.

Of course this does not mean blind optimism where you get sucked in with the crowd when it becomes euphoric or into every new whiz bang investment obsession that comes along (with bitcoin the latest in a long list of manias that goes back to Dutch tulip bulbs and includes the dot com stocks of the late 1990s). If an investment looks and feels too good to be true and the crowd is piling in, then it probably is… particularly if the main reason you are buying in is because of huge recent gains and their extrapolation off into to the future. So the key is cautious optimism, not blind optimism.

But when it comes to conventional investments like shares, since 1900 shares in the US have had positive returns around seven years out of ten and in Australia it’s around eight years out of ten. So getting too hung up in permanent pessimism on the next financial crisis and when it will come and what will on the basis of history inevitably drive the market down in the two or three years out of ten may mean missing out on the years it rises.


Source: AMP Capital 29 November 2017

Author

Dr Shane Oliver, Head of Investment Strategy and Economics and Chief Economist at AMP Capital is responsible for AMP Capital’s diversified investment funds. He also provides economic forecasts and analysis of key variables and issues affecting, or likely to affect, all asset markets.

Important note: While every care has been taken in the preparation of this article, AMP Capital Investors Limited (ABN 59 001 777 591, AFSL 232497) and AMP Capital Funds Management Limited (ABN 15 159 557 721, AFSL 426455) makes no representations or warranties as to the accuracy or completeness of any statement in it including, without limitation, any forecasts. Past performance is not a reliable indicator of future performance. This article has been prepared for the purpose of providing general information, without taking account of any particular investor’s objectives, financial situation or needs. An investor should, before making any investment decisions, consider the appropriateness of the information in this article, and seek professional advice, having regard to the investor’s objectives, financial situation and needs. This article is solely for the use of the party to whom it is provided.

I don’t normally comment directly on articles by others but an article by Matt Barrie with Craig Tindale called “Australia’s economy is built on shaky foundations, and it’s about to collapse,” has been sent to me several times for comment so I thought I would make an exception this time. 

The gist of the article seems to be that growth in the Australian economy has been built on “a property bubble inflating on top of a mining bubble, built on top of a commodities bubble, driven by a Chinese bubble” and that “Australia has relied on China for too long – our whole economy is built on China buying our stuff. And it’s about to collapse.”

This note takes a look at this risk.

Crash calls for the Australian economy are like a broken record

The first thing to note is that there is nothing really new in the latest call for a collapse in the Australian economy. In fact, for as long as I have been an economist there have been calls for the Australian economy to collapse. Back in 1985, I recall going to presentations on fears the economy might soon “default” and require a rescue by the IMF. The crash calls have accentuated post the Global Financial Crisis (GFC). The Australian economy was supposed to have crashed when the mining investment boom ended in 2012-13 and every year since then there has been an ad on the internet titled “Australian recession 2014: why it’s coming, what to do and how you can profit” but the year just keeps getting updated to the current year. I guess it will be right one day. 

Is China about to collapse?

China is Australia’s number one trading partner so Australia is more vulnerable to the Chinese economy than in the past. But warnings of a Chinese collapse have been around for years now and I continue to regard it as unlikely. The most common concerns about high and rising debt in China miss the reality that China’s high debt growth reflects its high saving rate (of around 46% of GDP compared to around 22% in Australia), which in turn gets largely channelled through the banking system as its capital markets remain underdeveloped. China does not rely on foreign capital (in fact it supplies savings to the rest of the world) and to slow its debt growth, it actually needs to save less and spend more (so very different to countries that normally have debt problems!) and broaden its capital market beyond the banks. But this will take time and the Chinese authorities will not act precipitously. And in the meantime, yes, there is a risk that some corporate loans will go bad but don’t forget much of the growth in debt has gone from state-owned banks to state-owned businesses and will be supported by the Government if there is too much trouble (just like the Chinese Government solved its local government debt problem of a few years ago).

But isn’t China at peak commodity demand?

Similarly, concerns about China’s property market and commodity demand are misplaced. The Chinese property cycle has regular ups and down as the property market is generally undersupplied but the Government periodically tries to keep a lid on prices. But every time there is a downturn in the property cycle (usually after Government moves to cool it down), out comes new crash stories. The “ghost cities” stories of a few years ago were evident of this but were literally just scary stories – they are part of an effort to decentralise away from crowded cities and the biggest “ghost city” (Ordos Kangbashi) is now almost full. The reality is that much of China continues to have a housing shortage as the population urbanises and many of the apartments built 20 years ago are now substandard and need to be replaced. So demand for steel and concrete from the property market is likely to remain strong for many years to come. Similarly, much of China remains under developed in terms of infrastructure. So yes, China is trying to wind back excess capacity in some sectors that have got ahead of themselves but peak raw material demand from China is a long way off. Yes, Chinese growth could slow towards 6% over the next few years but I doubt a hard landing any time soon. Certainly there was no sign of any hard landing in China when I visited it again in the last week – things were just as frantic as ever!

Australia has always had some export dependence

It’s worth noting that over the years Australia has always seemed to have some dependence on some foreign country in terms of export demand – the UK, Japan, it’s now China but as China’s industrialisation phase slows I suspect other countries will just jump into the commodity demand space (Vietnam, India, Pakistan) and in any case our relationship with China is also shifting across to services.

But the mining boom has long ended so why hasn’t the Australian economy collapsed already?

If Australia is so dependent on the commodity price boom and mining investment boom, why didn’t it crash when they crashed after 2011 and 2012-13 respectively? The simple answer is that the Australian economy is actually less dependent on mining and hence China than many commentators claim. In reality, mining activity is only 7% of Australian economic activity (or GDP) and agriculture is 3%, which taken together hardly suggests an excessive reliance on exports and China.

The mining boom basically meant that south east Australia – and sectors like manufacturing, tourism and higher education along with housing – was suppressed by high interest rates and the high Australian dollar. Once the commodity and mining investment booms went away and interest rates and the $A fell, south east Australia was able to bounce back offsetting the slump in Western Australia and the Northern Territory and parts of Queensland. So Victoria, NSW and even Tasmania were able to go from near recessionary conditions and at the bottom of state rankings a decade ago to now being at the top.   

More than housing

This has not just been driven by housing-related activity, smashed avocados and flat whites (how come Chai tea brewed with soy never gets a look in?) but also in services like tourism and higher education (our third biggest export earner), which are booming. Even manufacturing is looking better. In fact, for many Australians the China driven mining boom was more a curse than a blessing – the saying in Sydney was that the people of western Sydney were paying the price for the mining boom in Western Australia.

Housing construction is starting to slow causing many to wheel out the disaster scenarios again. But the contribution to economic growth from growth in housing construction is regularly exaggerated. Last year it contributed around 0.3% directly to growth and indirect effects are likely to have taken that contribution to around 0.6%. In other words its relatively modest and a housing construction slowdown should be easily offset as the drag on growth (of around 1-1.5% per annum) from slumping mining investment is nearly over, infrastructure spending is booming (partly on the back of the asset swap program), non-mining investment looks to be bottoming at last and export volume growth is strong.

What about a house price crash?

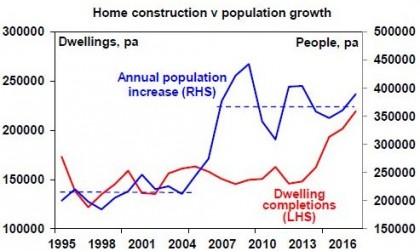
Yes, there is a risk of a house price collapse but it’s a lot more complicated than most people think as pointed out in my last house price note http://bit.ly/2y97kCE . Basically: we have not built enough housing to keep up with strong population growth since mid-last decade (see the next chart); the boom lately has been confined to Sydney and Melbourne (which were more harmed than helped by the mining/China-related boom); and the deterioration in lending standards has been modest with, for example, little in the way of the NINJA (no income, no jobs, no assets) loans that caused so much trouble in the US. 

Source: ABS; AMP Capital

Sydney and Melbourne home prices are likely to fall by 5-10% (like in 2008 and 2011-12) but a crash is unlikely unless unemployment goes up a lot (unlikely), the RBA raises rates aggressively (again unlikely) or the current unit supply surge continues for several more years (again unlikely with approvals off their peak). 

More than “dumb luck” in Australia’s 26-year expansion

While luck has played a role in Australia’s 26 years of economic expansion, it’s worth noting that the China-related boom only really ran for eight or nine years of it (from 2004-2012), and a significant contribution came from the economic reforms of the 1980s and 1990s that made the Australian economy more flexible in responding to shocks. Also, sensible economic policy meant that we managed the China boom well (by avoiding an overheating economy and running budget surpluses), which meant we were better placed to ride out the global shock from the GFC and the subsequent end to the commodity and mining investment booms.

26 years of economic expansion has left the Australian economy with lots to show for it: the economy is 129% bigger in real terms than it was when the 1990-91 recession ended, per capita GDP is up 61%, unemployment is less than half its early 1990s high and our dependence on foreign capital as measured by the current account deficit relative to GDP is about one third smaller than it was 26 years ago. Sure we can do better – underemployment, weak wages growth and poor housing affordability are serious problems and we seem to have given up on serious economic reform – but the economy is in better shape than some give it credit for.

Australia versus the world

Finally, I should note that while we are not in the crash camp for Australia, we remain of the view that it will be a while before interest rates can rise and that Australian economic and profit growth will be subpar compared to other countries for a while yet. As a result, we remain of the view that while Australian shares have more upside they are likely to remain relative underperformers versus global shares for some time yet and that the Australian dollar still has more downside. This is really just a continuation of the “mean reversion” of the huge outperformance in Australian shares versus global shares and in the Australian dollar seen last decade. 


Source: AMP Capital 22 November 2017

Author: Dr Shane Oliver, Head of Investment Strategy and Economics and Chief Economist at AMP Capital is responsible for AMP Capital’s diversified investment funds. He also provides economic forecasts and analysis of key variables and issues affecting, or likely to affect, all asset markets.

Important note: While every care has been taken in the preparation of this article, AMP Capital Investors Limited (ABN 59 001 777 591, AFSL 232497) and AMP Capital Funds Management Limited (ABN 15 159 557 721, AFSL 426455) makes no representations or warranties as to the accuracy or completeness of any statement in it including, without limitation, any forecasts. Past performance is not a reliable indicator of future performance. This article has been prepared for the purpose of providing general information, without taking account of any particular investor’s objectives, financial situation or needs. An investor should, before making any investment decisions, consider the appropriateness of the information in this article, and seek professional advice, having regard to the investor’s objectives, financial situation and needs. This article is solely for the use of the party to whom it is provided.

Introduction

The surge in bitcoin has attracted much interest. Over the last five years, it has soared from $US12 to over $US8000; this year it’s up 760%. Its enthusiasts see it as the currency of the future and increasingly as a way to instant riches with rapid price gains only reinforcing this view. An alternative view is that it is just another in a long string of bubbles in investment markets.

Nobel Economics Laureates Daniel Kahneman, Robert Shiller and Richard Thaler and many others shown that investors and hence investment markets can be far from rational and this along with crowd psychology can drive asset prices far from fundamentally justified levels. This note provides a refresher on the psychology of investing before returning to look at bitcoin.

Irrational man and the madness of crowds

Numerous studies show people suffer from lapses of logic. In particular, they:

  • Tend to down-play uncertainty and project the current state of the world into the future – eg, resulting in a tendency to assume recent investment returns will continue;

  • Give more weight to recent spectacular or personal experiences in assessing probabilities. This results in an emotional involvement with an investment – if it’s been winning, an investor is likely to expect it to keep doing so;

  • Tend to focus on occurrences that draw attention to themselves such as stocks or asset classes that have risen sharply or fallen sharply in value;

  • Tend to see things as obvious in hindsight – driving the illusion the world is predictable resulting in overconfidence;

  • Tend to be overly conservative in adjusting expectations to new information – explaining why bubbles and crashes normally unfold over long periods; and

  • Tend to ignore information conflicting with past decisions.

This is magnified and reinforced if many make the same lapses of logic at the same time giving rise to “crowd psychology”. Collective behaviour can arise if several things are present:

  • A means where behaviour can be contagious – mass communication with the proliferation of electronic media are perfect examples of this as more than ever investors get their information from the same sources;

  • Pressure for conformity – interaction with friends, social media, performance comparisons, fear of missing out, etc;

  • A precipitating event or displacement which motivates a general investment belief – the IT revolution of the late 1990s or the rapid industrialisation of China which led to talk of new eras are examples upon which were built general believes that particular investments will only go up.

Bubbles and busts

The combination of lapses of logic by individuals and their magnification by crowds goes a long way to explaining why speculative surges in asset prices develop (usually after some good news) and how they feed on themselves (as individuals project recent price gains into the future, exercise “wishful thinking” and receive positive feedback via the media). Of course this also explains how the whole process can go into reverse once buying is exhausted, often triggered by bad news.

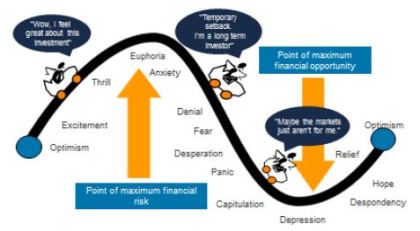
The chart below shows how investor psychology develops through a market cycle. When times are good, investors move from optimism to excitement, and eventually euphoria as an asset’s price moves higher and higher. So by the time the market tops out, investors are maximum bullish and fully invested, often with no one left to buy. This ultimately sets the scene for a bit of bad news to push prices lower. As selling intensifies and prices fall further, investor emotion goes from anxiety to fear and eventually depression. By the time the market bottoms out, investors are maximum bearish and out of the market. This sets the scene for the market to start rising as it only requires a bit of good news to bring back buying.

The roller coaster of investor emotion


Source: Russell Investments, AMP Capital

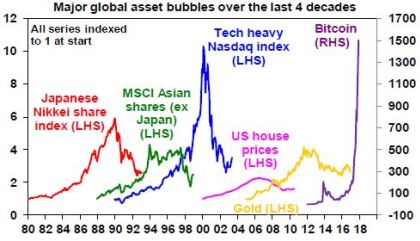
This pattern has been repeated over the years. Recent examples on a globally-significant basis have been the Japanese bubble and bust of 1980s/early 1990s, the “Asian miracle” boom and bust of the 1990s, the tech boom and bust of the late 1990s/early 2000s, the US housing and credit-related boom and bust of last decade and the commodity boom and bust of late last decade into this decade. History may not repeat but rhymes and tells us asset price bubbles & busts are normal.

Where are we now?

Our assessment in terms of global share markets is that we are still around “optimism”. Investor sentiment is well up from its lows last year and some short-term measures are a bit high, warning of a correction (particularly for the direction-setting US share market) but we are not seeing the “euphoria” seen at market tops. The proportion of Australians nominating shares as the “wisest place for savings” remains very low at 8.9%.

But what about bitcoin? Is it a bubble?

Crypto currencies led by bitcoin and their blockchain technology seem to hold much promise. The blockchain basically means that transactions are verified and recorded in a public ledger (which is the blockchain) by a network of nodes (or databases) on the internet. Because each node stores its own copy, there is no need for a trusted central authority. Bitcoin is also anonymous with funds just tied to bitcoin addresses. Designed to work as a currency, bitcoin therefore has much to offer as a low-cost medium of exchange with international currency transfers costing a fraction of what, say, a bank may charge.

However, bitcoin’s price in US dollars has risen exponentially in value in recent times as the enthusiasm about its replacement for paper currency and many other things has seen investors pile in with rapid price gains and increasing media attention reinforcing perceptions that it’s a way to instant riches.

However, there are serious grounds for caution. First, because bitcoin produces no income and so has no yield, it’s impossible to value and unlike gold you can’t even touch it. This could mean that it could go to $100,000 but may only be worth $100.

Second, while the supply of bitcoins is limited to 21 million by around 2140, lots of competition is popping up in the form of other crypto currencies. In fact, there is now over 1000 of them. A rising supply of such currencies will push their price down.

Third, governments are unlikely to give up their monopoly on legal tender (because of the “seigniorage” or profit it yields) and ordinary members of the public may not fully embrace crypto currencies unless they have government backing. In fact, many governments and central banks are already looking at establishing their own crypto currencies.

Regulators are likely to crack down on it over time given its use for money laundering and unregulated money raising. China has moved quickly on this front. Monetary authorities are also likely to be wary of the potential for monetary and financial instability that lots of alternative currencies pose.

Fourth, while bitcoin may perform well as a medium of exchange it does not perform well as a store of value, which is another criteria for money. It has had numerous large 20% plus setbacks in value (five this year!) meaning huge loses if someone transfers funds into bitcoin for a transaction – say to buy a house or a foreign investment – but it collapses in value before the transaction completes.

Finally, and related to this, it has all the hallmarks of a classic bubble as described earlier in this note. In short, a positive fundamental development (or “displacement”) in terms of a high tech replacement for paper currency, self-reinforcing price gains that are being accentuated by social media excitement, all convincing enthusiasts that the only way is up. Its price now looks very bubbly, particularly compared to past asset bubbles (see the next chart – note bitcoin has to have its own axis!).

Because bitcoin is impossible to value, it could keep going up for a long way yet as more gullible investors are sucked in on the belief that they are on the way to unlimited riches and those who don’t believe them just “don’t get it” (just like a previous generation said to “dot com” sceptics). Maybe it’s just something each new generation of young investors has to go through – based on a thought that there is some way to instant riches and that their parents are just too square to believe it.

Source: Thomson Reuters, Bloomberg, AMP Capital

But the more it goes up, the greater the risk of a crash. I also still struggle to fully understand how it works and one big lesson from the Global Financial Crisis is that if you don’t fully understand something, you shouldn’t invest.

At this stage, a crash in bitcoin is a long way from being able to crash the economy because unlike previous manias (Japan, Asian bubble, Nasdaq, US housing in the chart above) it does not have major linkages to the economy (eg it’s not associated with overinvestment in the economy like in tech or US housing, it is not used enough to threaten the global financial system and not enough people are exposed to it such that a bust will have major negative wealth effects or losses for banks).

However, the risks would grow if more and more “investors” are sucked in – with banks ending up with a heavy exposure if, say, heavy gearing was involved. At this stage, I think it’s unlikely that will occur for the simple reason that being just an alternative currency and means of payment won’t inspire the same level of enthusiasm that, say, tech stocks did in the late 1990s (where there was a real revolution going on).

That said, it’s dangerous to say it can’t happen. There was very little underpinning the Dutch tulip mania and it went for longer than many thought. So it’s worth keeping an eye on. But as an investor I’m staying away from bitcoin.

What does this mean for investors?

There are several implications for investors.
 

  1. The first thing investors need to do is recognise that investment markets are not only driven by fundamentals, but also by the often-irrational and erratic behaviour of an unstable crowd of other investors.

  2. Investors need to recognise their own emotional capabilities. In other words, investors must be aware of how they are influenced by lapses in their own logic and crowd influences.

  3. To help guard against this, investors ought to choose an investment strategy which can withstand inevitable crises & remain consistent with their objectives and risk tolerance.

  4. If an investor is tempted to trade they should do so on a contrarian basis. Buy when the crowd is bearish, sell when it is bullish. But also recognise contrarian investing is not fool-proof – just because the crowd looks irrationally bullish (or bearish) doesn’t mean it can’t get more so.

  5. Finally, while crypto currencies and blockchain technology may have a lot to offer bitcoin’s price is very bubbly.

Source: AMP Capital 21 November 2017

Author: Dr Shane Oliver, Head of Investment Strategy and Economics and Chief Economist at AMP Capital is responsible for AMP Capital’s diversified investment funds. He also provides economic forecasts and analysis of key variables and issues affecting, or likely to affect, all asset markets.

Important note: While every care has been taken in the preparation of this article, AMP Capital Investors Limited (ABN 59 001 777 591, AFSL 232497) and AMP Capital Funds Management Limited (ABN 15 159 557 721, AFSL 426455) makes no representations or warranties as to the accuracy or completeness of any statement in it including, without limitation, any forecasts. Past performance is not a reliable indicator of future performance. This article has been prepared for the purpose of providing general information, without taking account of any particular investor’s objectives, financial situation or needs. An investor should, before making any investment decisions, consider the appropriateness of the information in this article, and seek professional advice, having regard to the investor’s objectives, financial situation and needs. This article is solely for the use of the party to whom it is provided.

The disappointing retail sales figures from the last quarter could be just the tip of the iceberg for those watching the retail sector heading into Christmas, reckons Dermot Ryan, AMP Capital’s Portfolio Manager – Australian Equities.

But it’s not likely to be the so called “Amazon effect” of internet shopping, nor competition from fast fashion retailers, or even unfavourable currency swings Ryan is factoring in when he’s calling out the possibility we’re heading for a flat Christmas in terms of spending and economic growth – although all three of these factors could prove to be head winds for retailers but a boon for shoppers.

It’s the debt overhang from the housing boom that could end up casting the longest and coldest shadow over Australia’s Christmas cheer, Ryan says, pointing out he’s reading the data and not himself the Christmas Grinch.

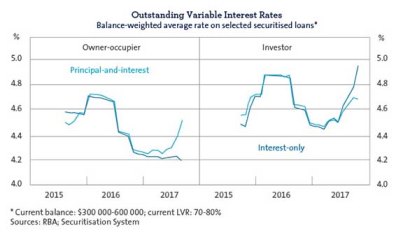
“We’re at the mature stage of a housing cycle where a lot of mortgagees have large debts and some groups have overextended themselves buying property. Even before the RBA (Reserve Bank of Australia) thinks about raising interest rates this year, stresses are appearing as banks raise the cost of interest only and investor loans and I’m guessing it will seriously curtail their ability to spend this festive season,” Ryan explains.         
 
Much has been said and written about the challenges facing retailers, firstly stemming from new competition coming to Australia, and secondly as technology facilitates better price discovery which has the effect of eating into retailers’ margins. 

The September quarter was the first quarterly decline in retail sales figures since 2012 and only the fourth recorded decline since the global financial crisis, according to the Australian Bureau of Statistics data released in early November.

The market had forecast a rebound in September following a steep fall in retail sales the previous month – the largest monthly decline recorded by the ABS in close to five years – but that rebound never materialised.

However, reading further into the data, Ryan believes the hefty weight of mortgage payments – which he points out Australian households remain on the hook for – have not impacted retail sales to the extent he ultimately expects they will… yet.

See, when a mortgage customer moves from an interest only mortgage to a principle and interest mortgage, there can be up to a 40 per cent increase in monthly repayments, Ryan explains. This change has a big impact on what left over at the end of the month, particularly for young families who are amongst the most indebted cohorts, he adds.

“It does seem like the increased mortgage payments are starting to make an initial dent into retail sales. This has further to play out given the mortgage rate hikes and ongoing push to switch mortgages to P&I (principal and interest) loans from interest only loans,” Ryan notes.

All the major banks and many of the regional institutions have raised lending rates – particularly on interest only loans – even though the RBA has kept its 1.5 per cent cash rate on hold this year.

Meanwhile, mortgagees, particularly those with interest-only loans, are already feeling the pinch, Ryan highlights.

“There are also a lot of uncontrollable cost increases for households like electricity, insurance and education that are also rising and crimping disposable income,” Ryan adds.

Cutting spending is the first thing households worried about mortgage repayments will do, Ryan says, highlighting the findings of a recent UBS study which surveyed Australians who had recently taken out a mortgage to buy a residential property.

Half of those surveyed who said they were feeling anxious about repayments said they’d cut spending while others surveyed said they’d likely opt to switch to principle and interest loans.

Switching to P&I loans increases monthly mortgage costs by 30-40 per cent which won’t be good for household spending either, Ryan highlights.

It’s clear the hangover from the housing boom and its potential impact on spending and economic growth is on the radar of the RBA too; at the latest monetary policy decision RBA Governor Philip Lowe noted “a continuing source of uncertainty is the outlook for household consumption” adding that “inflation is likely to remain low for some time, reflecting the slow growth in labour costs and increased competitive pressures, especially in retailing.”

 “Looking at the data it’s clear this trend to P&I is still in play which points to a difficult Christmas ahead,” Ryan notes.

Source : AMP Capital 10 November 2017 

Important note: While every care has been taken in the preparation of this article, AMP Capital Investors Limited (ABN 59 001 777 591, AFSL 232497) and AMP Capital Funds Management Limited (ABN 15 159 557 721, AFSL 426455) makes no representations or warranties as to the accuracy or completeness of any statement in it including, without limitation, any forecasts. Past performance is not a reliable indicator of future performance. This article has been prepared for the purpose of providing general information, without taking account of any particular investor’s objectives, financial situation or needs. An investor should, before making any investment decisions, consider the appropriateness of the information in this article, and seek professional advice, having regard to the investor’s objectives, financial situation and needs. This article is solely for the use of the party to whom it is provided.

When Australia’s High Court ruled deputy prime minister Barnaby Joyce ineligible to sit in Parliament because of his dual New Zealand citizenship, the decision briefly sent tremors through equity and currency markets. It was a clear reminder that political risk matters to markets.

We face troubling political and geopolitical risk across the world: Trump, Brexit and, above all, the risk of nuclear confrontation with North Korea. Yet some investors, used to QE-fuelled rises, have simply forgotten about political risk and are maintaining highly concentrated portfolios, which exposes them to the fallout from political shocks.

To protect against heightened risk to portfolios, advisers and investors need to begin assessing political risk objectively from a multi-dimensional perspective. This involves four key steps. If they can grasp those steps, they will not only get better portfolio protection, but also gain a broader insight into the field of managing risk and uncertainty as investors.

1.    Put some odds on it

The first step is to put some probability on the risk of the event happening. As we headed towards Britain’s referendum on whether to remain in, or leave, the European Union, we believed the probability was 50/50: there was a 50 per cent chance a leave vote would win; and a 50 per cent chance Britain would stay in the EU. But the market was pricing in a much higher probability of Britain remaining – 80 per cent. Financial markets were pricing in the prevailing view in London and ignoring the rest of the country. The market, therefore, hadn’t priced in the risk of Brexit, especially in the pound. We took advantage of that gap and took a short position in the pound as a hedge.

2.    Assess likely impact

The second step is to determine the impact of the political event. If the impact is likely to be extremely high, then it may make sense to move to help protect your portfolio. A North Korean nuclear attack might be unlikely, but the impact would obviously be horrific.

But sometimes the market overstates the possible impact of a political event. The market frets about a Donald Trump impeachment or US political risk. But we believe the impact of an impeachment and political paralysis is relatively low.

The impact might be high in the short term, but not in the long run. For the first time in eight years we have the Republicans in control of both the Senate and the House and they are motivated to get a fiscal package announced before the mid-term election in 2018. So, it’s a risk we’re aware of but we’re not doing anything about it.

3.    Ask how much of that bad scenario is priced into the market.

The third step is to analyse how much the political risk is priced into the market. Broadly, if everyone is talking about a political risk, it’s usually priced in and it’s too late for us to do anything.

But other various measures provide guidance, including volatility and sentiment measures. Low volatility and crowded positions usually mean investors are not pricing in risk. Conversely, if investors are avoiding or have sold out of a position, volatility is high, valuations are cheap, and everyone is talking about it, then political risk is likely priced in.

Sentiment measures help gauge investor enthusiasm. If everyone is enthused about the downside, then bad news is priced in. If everyone is enthused about the upside, then risk is usually not priced in. Valuations measures such as price-to-earnings and price-to-book ratios for equities, and real effective exchange rates for currencies, are also useful.

4.    Construct a portfolio that accounts for risk

The final step is to construct your portfolio to account for the risk. That may involve using put options, shorting an asset class, or using currencies to hedge.

If we look again at North Korea, our previous steps have told us that the probability of an attack is low. That’s similar to what the broader market believes. But the impact if it did happen would be devastating, so we want some protection in the form of a ‘tail hedge’. (A tail hedge helps protect against extreme market event scenarios that are unlikely to happen, but have a very high impact.)

What is an asset class that would benefit in the unlikely event of a North Korean attack? Gold. Because the probability of an attack is low, we have a small 3 per cent allocation to gold. But if North Korea attacked, the impact would be so huge that the small allocation to gold is likely to multiply upwards of 300 per cent.

Currencies are another great lever for managing political risk. Italians go to the polls to elect a new government by May 20 next year. There is a risk, albeit relatively low, that Eurosceptic parties will do well, triggering fresh talk of a breakdown of Europe. But we don’t believe that risk is priced into the euro, which warrants a short position.

Less fearful investment

The recent events surrounding Barnaby Joyce’s eligibility, as well as the history of markets shows that political risk surrounds us, and that political events can rock markets and severely damage portfolios. Yet when political risks hit markets, investors are often caught by surprise. They then panic, as they did back in 2008, and often sell at exactly the wrong time.

I well remember back in October 2008 when the House of Representatives rejected a $700 billion financial rescue package, triggering one of the biggest stock sell-offs in history. The market had been expecting the bill to pass.

By firstly being aware of political risks, then objectively assessing those risks, investors can remove that emotional element and better prepare their portfolios to weather those risks. Not only is their portfolio potentially going to benefit, but their fears around investment performance and volatility will also ease.

Source : AMP Capital 8 November 2017 

About the Author 

Nader Naeimi has more than 19 years of experience in Australia’s financial markets, including 16 years at AMP Capital. As the Head of Dynamic Markets, he is responsible for leading the Dynamic Asset Allocation strategy for the Multi-Asset Group, as well as other macro strategies and asset allocations for several AMP Capital funds.


While every care has been taken in the preparation of this document, AMP Capital makes no representation or warranty as to the accuracy or completeness of any statement in it including without limitation, any forecasts. This document has been prepared for the purpose of providing general information, without taking account of any particular investor’s objectives, financial situation or needs. Investors and their advisers should, before making any investment decisions, consider the appropriateness of the information in this document, and seek professional advice, having regard to the investor’s objectives, financial situation and needs.

The low interest rates of recent times along with periodic turmoil in investment markets has provided us with a reminder of the importance of the income (cash) flow or yield an investment provides. It’s particularly important for those relying on investment income to fund their living expenses. As with all investment topics, investing for income can seem complicated and daunting once you move beyond bank deposits but in fact it’s really quite simple. So this note looks at five charts I find useful in understanding investing for income or yield.

Chart #1 There are lots of alternatives to bank deposits

The yield an investment provides is basically its annual cash flow divided by the value of the investment.
 

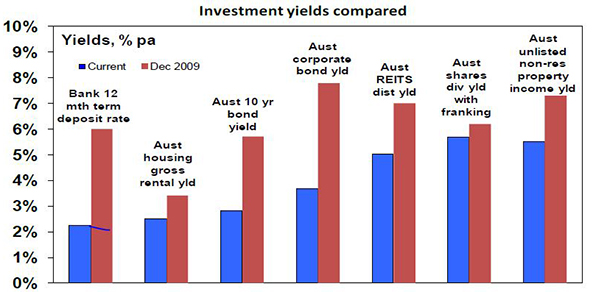
  • For bank deposits, the yield is simply the interest rate, eg bank 1-year term deposit rates in Australia are about 2.25% and so this is the cash flow they will yield in the year ahead.

  • For ten-year Australian Government bonds, annual cash payments on the bonds (coupons) relative to the current price of the bonds provides a yield of 2.8% right now.

  • For corporate debt, it’s a margin above government bond yields and depends on the riskiness of the company but is currently averaging around 3.6% in Australia.

  • For residential property, the yield is the annual value of rents as a percentage of the value of the property. On average in Australian capital cities it is about 3.9% for apartments and around 2.5% for houses. After allowing for costs, net rental yields are about 2 percentage points lower.

  • For unlisted commercial property, yields are around 5.5%. For infrastructure investment it averages around 4.5%.

  • For a basket of Australian shares represented by the ASX 200 index, annual dividend payments are running around 4.3% of the value of the shares. Once franking credits are allowed for, this pushes up to around 5.7%.


The next chart shows the yield available on a range of investments both now and in December 2009.


Source: Bloomberg, REIA, RBA, JLL, AMP Capital

Key messages: first, there are plenty of alternatives to cash when it comes to yield or income. Second, the yields on these investments will move over time and since the aftermath of the Global Financial Crisis (GFC) the trend has been down.

Of course investors need to allow for risk. Bank deposits have close to zero risk but any move to higher-yielding investments does entail taking on risk. More on this later.

Chart #2 The gap between yields on different assets relative to historic norms provides a guide to value

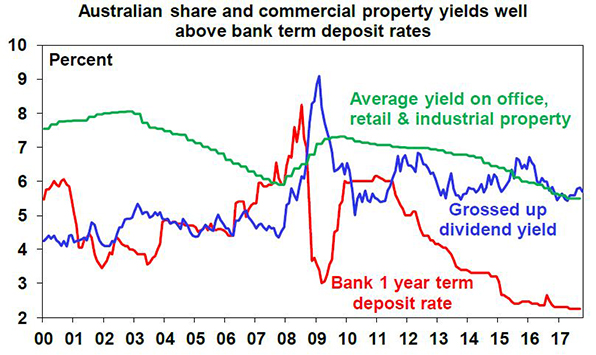
The next chart shows average yields on Australian shares and unlisted commercial property relative to the one-year term deposit rate since 2000. While yields have fallen, the gap between share and property yields and the bank deposit rate is extreme historically, with neither share or property yields plunging to the degree bank deposit rates have. In fact, the share yield is in its historic range. All things equal, this suggests commercial property and Australian shares continue to provide better value. The same would apply to unlisted infrastructure. 


Source: JLL, Bloomberg, AMP Capital

Key message: comparing yields provides a guide to relative value and right now shares and unlisted commercial property remain very attractive relative to bank deposits.

Chart #3 Shares can provide stronger growth in income with less volatility than bank deposits

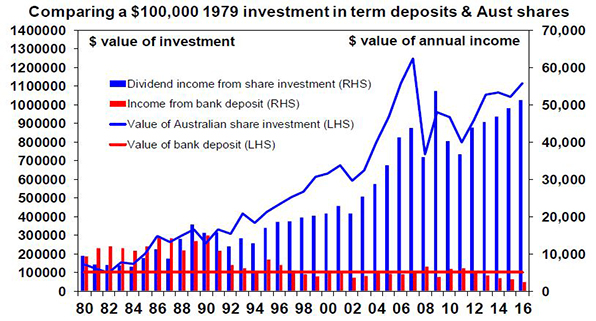
Investing in shares of course entails the risk of capital loss. But it can offer a higher and less volatile income flow over time. The next chart is a bit heavy but it compares initial $100,000 investments in Australian shares and one-year term deposits in December 1979 and the income they have provided over time (before franking credits are allowed for in the case of shares).


Source: RBA, Bloomberg, AMP Capital

The term deposit would still be worth $100,000 (red line) and last year would have paid roughly $2450 in interest (red bars). By contrast the $100,000 invested in shares would have grown to $1.12 million (blue line) by end 2016 and last year would have paid $51,323 in dividends before franking credits (blue bars). The point is that dividends tend to grow over time (because profits and hence an investment in shares tends to rise in value) and are relatively stable compared to income from bank deposits, which vary with interest rate settings. Over the period the worst decline in dividend income from shares was a 32% decline between 2009 and 2011, whereas the income from bank deposits plunged 68% between 1990 and 1994 and by 60% between 2011 and last year. Once franking credits are allowed for, the comparison would become even more favourable towards shares.

Key message: while shares come with the risk of capital loss, a well-diversified portfolio of Australian shares can provide stronger growth in income with less volatility in that income than bank term deposits. Investors focussed on income need to decide what is most important: stability in the value of their investment or a higher, more sustainable income flow. The key when investing in shares for income is to have a well-diversified portfolio. Or better still a well-diversified portfolio of shares paying high and sustainable dividend yields. Finding high dividend yields is easy but the key is to look for stocks that have a reliable track record of growing those dividends and that have dividends that are not threatened by things like excessive gearing.

Chart #4 A bird in the hand is worth two in the bush

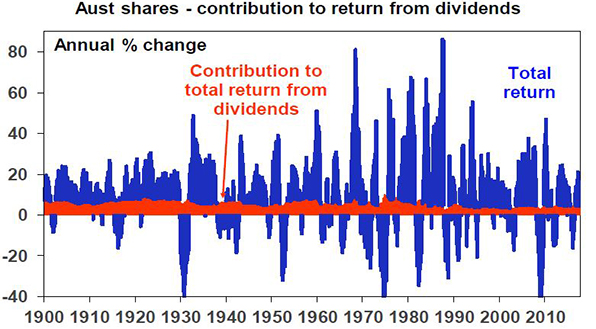
A high and sustainable starting point yield provides some security during volatile times. Since 1900, dividends (prior to allowing for franking credits) have provided just over half of the 11.8% average annual return from Australian shares and as can be seen in the next chart their contribution has been stable in contrast to the capital value of shares.


Source: Global Financial Data, Bloomberg, AMP Capital

Dividends are relatively smooth over time because most companies hate having to cut them as they know it annoys shareholders so they prefer to keep them sustainable.

Key message: a high and sustainable income yield for an investment provides some security during volatile times. It’s a bit like a down payment on future returns.

Chart #5 Yield provides a guide to future returns

The yield an investment provides forms the building block for its total return, which is essentially determined by the following.  
 

Total return = yield + capital growth


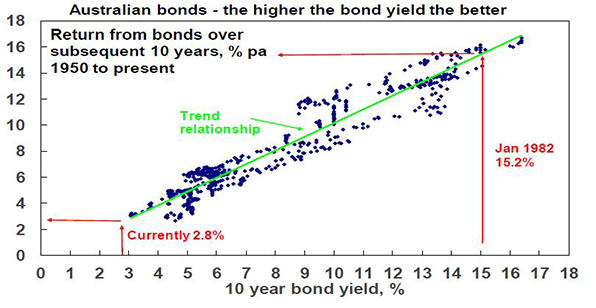
As a general principle, the higher the yield an investor invests at, the higher the return their investment will likely provide. This is self-evident in the case of bank deposits because the yield is the return (assuming the bank does not default on its deposits – which is very unlikely in Australia given Government protections). It can be seen in relation to bonds in the next chart, which shows a scatter plot of Australian ten-year bond yields since 1950 (along the horizontal axis) against subsequent ten-year bond returns based on the Composite All Maturities Bond Index (vertical axis). Over short term periods, bond prices can move up and down and so influence short-term returns, but over the medium term the main driver of the return a bond investor will get is what bond yields were when they invested. If the yield on a ten-year bond is 5%, then if you hold the bond to maturity your return will be 5%. Of course a portfolio of bonds will reflect a range of maturities and so the relationship is not perfect, but it can be seen in the next chart that the higher the starting point bond yield, the higher the subsequent return.


Source: Global Financial Data, Bloomberg, AMP Capital

Put simply when bond yields are high they drive high bond returns over the medium term and vice versa. For example, when Australian ten-year bond yields in January 1982 were 15.2% it’s not surprising that returns from bonds over the subsequent ten years were 15.4% per annum. Similarly, when bond yields were just 3.1% in January 1950, it’s no surprise that returns from bonds over the next ten years were 3.1%. At 2.8% now, we are off the bottom of the chart meaning record low bond returns for the next decade.

Similar albeit less perfect relationships exist for other asset classes – the higher the yield, the higher the subsequent return.

Of course there are some risks investors must watch out for. At the individual share level, a very high dividend yield may be a sign of a “value trap” – where current profits and dividends may be fine but there is an impending threat to the company and so the share price is low. Second, high distributions may also be unsustainable if they are being paid for out of debt and reflect excessive gearing or high risk investments (eg, sub-prime mortgages prior to the GFC). Just remember that there is no free lunch.

Key message: while returns have been solid lately, low investment yields do warn of lower returns ahead – most notably from government bonds.


Source: AMP Capital 24 October 2017

Author: Dr Shane Oliver, Head of Investment Strategy and Economics and Chief Economist at AMP Capital is responsible for AMP Capital’s diversified investment funds. He also provides economic forecasts and analysis of key variables and issues affecting, or likely to affect, all asset markets.

Important note: While every care has been taken in the preparation of this article, AMP Capital Investors Limited (ABN 59 001 777 591, AFSL 232497) and AMP Capital Funds Management Limited (ABN 15 159 557 721, AFSL 426455) makes no representations or warranties as to the accuracy or completeness of any statement in it including, without limitation, any forecasts. Past performance is not a reliable indicator of future performance. This article has been prepared for the purpose of providing general information, without taking account of any particular investor’s objectives, financial situation or needs. An investor should, before making any investment decisions, consider the appropriateness of the information in this article, and seek professional advice, having regard to the investor’s objectives, financial situation and needs. This article is solely for the use of the party to whom it is provided.