The threat of a full-blown trade war has escalated in the last few weeks with the G7 meeting ending in disarray over US tariffs on imports of steel and aluminium from its allies and more importantly President Trump threatening tariffs on (so far at least) $US450bn of imports from China, and China threatening to retaliate. Our base case remains that a negotiated solution will ultimately be reached, but the pain threshold in the US is clearly higher than initially thought and the risks have increased.

Background on trade wars and protectionism

A trade war is a situation where countries raise barriers to trade, with each motivated by a desire to “protect’’ domestic workers, and sometimes dressed up with “national security” motivations. To be a “trade war” the barriers need to be significant in terms of their size and the proportion of imports covered. The best-known global trade war was that of 1930 where average 20% tariff hikes on most US imports under Smoot-Hawley legislation led to retaliation by other countries and contributed to a collapse in world trade.

A basic concept in economics is comparative advantage: that if Country A and B are both equally good at making Product X but Country B is best at making Product Y then they will be best off if A makes X and B makes Y. Put simply free trade leads to higher living standards and lower prices, whereas restrictions on trade lead to lower living standards and higher prices. The trade war of the early 1930s is one factor that helped make The Great Depression “great”. As RBA Governor Philip Lowe has observed “Can anyone think of a country that’s made itself wealthier or more productive by building walls?”

Access for US exports to China and stronger protection of US intellectual property. His comments at the recent G7 meeting where he proposed completely free trade suggest he secretly does support free trade (although it’s a bit hard to know for sure!)

Most of these issues were covered in more detail here.

Where are we now?

Fears of a global trade war were kicked off in early March with Trump announcing a 10% tariff on aluminium imports and a 25% tariff on steel imports. US allies were initially exempted but China was not and the exemptions for Canada, Mexico and the European Union expired on June 1. But tariffs on steel and aluminium imports are minor at around 1.5% of total US imports. There is a risk of escalation though as the affected countries retaliate.

However, the main focus remains China. On March 22, in response to the Section 301 intellectual property review (alleging theft by China), Trump proposed 25% tariffs on $US50bn of US imports from China and restrictions on Chinese investment in the US. At the same time, the US lodged a case against China with the World Trade Organisation. China then announced “plans” for 25% tariffs on $US50bn of imports from the US with a focus on agricultural products. Then Trump threatened tariffs on another $US100bn of imports from China in proposed retaliation to China’s proposed retaliation to which China said it would retaliate.

These tariffs were put on hold after a May 19 agreement between the US and China under which China agreed to import more from the US, reduce tariffs and strengthen laws to protect intellectual property, with negotiations around the details to come. Trump initially cheered the outcome, but after domestic criticism did a backflip and announced that the $US50bn in imports from China to be subject to a 25% tariff would be finalised by June 15, which they were (with a July 6 start date set for $US34bn) and that investment restrictions would be finalised by June 30.

After China said that the May 19 deal was no more and that it would match US tariffs, Trump upped the $US100bn to a 10% tariff on $US200bn of imports and said that if China retaliates to that it will do another $US200bn. This brings the tariffs on US imports from China to $US450bn which covers 90% of America’s total annual imports from China. Along the way Trump has also announced consideration of automobile tariffs – with the outcome yet to be announced.

Rising risk of a full-blown trade war

Clearly the escalating tariff threats have added to the risk of a full-blown trade war between the US and China, and with an escalation possible between the US and its allies. The initial tariffs on steel and aluminium and proposed for $US50bn of imports from China amount to a still small 3% or so of US imports or just 0.5% of US GDP so only a trivial impact and hardly a trade war.

But if there are tariffs on $US450 of imports it’s about 18% of total US imports and will have a bigger impact. On this scale it’s inevitable that consumer goods will be impacted. And with China only importing $US130bn from the US annually, it’s proportional retaliation to US tariffs will have to move into other areas like tougher taxation and regulation of US companies operating in China and selling US Treasury Bonds (although this will only push the Renminbi up which will make things worse for China).

And of course, with US allies preparing retaliation against US tariffs on steel and aluminium (eg EU tariffs on US whiskey and Harley Davidsons) there is a danger that conflict escalates here too as the US counter-retaliates. And then there’s potentially auto tariffs.

There is also the danger that President Trump’s flip flops on policy (particularly after the May 19 agreement with China) and the confusion as to who is handling the US negotiations (whatever happened to Treasury Secretary Mnuchin who declared that the trade war had been put on hold?) has damaged Trump’s and US credibility.

Economic impact

The negative economic impact from a full-blown trade war would come from reduced trade and the disruption to supply chains that this would cause. This is always a bit hard to model reliably. Modelling by Citigroup of a 10% average tariff hike by the US, China and Europe showed a 2% hit to global GDP after one year, with Australia seeing a 0.5% hit to GDP reflecting its lower trade exposure compared to many other countries, particularly in Asia which will face supply chain disruption. At present we are nowhere near an average 10% tariff hike (the average proposed tariff on $450bn of Chinese imports is 12% which across all US imports is around 2%). So this would need much further escalation from here.

It might also be argued that the US is best placed to withstand a trade war because it imports more from everyone else than everyone else imports from it and the negative impact from the proposed tariffs (which is running around $60bn in tax revenue out of the economy) is swamped by the $300bn in fiscal stimulus boosting the US economy. Trump also feels empowered because there is a lot of domestic support in the US for taking a tougher stance on trade (particularly amongst Republicans) and his approval rating has risen to 45% – the highest in his Presidency.

And the current situation mainly just involves the US and China (in terms of significant tariff announcements), so arguably Chinese and US goods flowing to each other could – to the extent that there are substitutes – just be swapped for goods coming from countries not subject to tariffs, thereby reducing the impact.

Some reasons for hope

So far what we have really seen is not a trade war but a trade skirmish. The tit for tat tariffs triggered in relation to US steel and aluminium imports are trivial in size. All the other tariffs are just proposals and the additional tariffs on $US200bn of imports from China plus another $US200bn would take months to implement, much like the initial tariffs on $US50bn. Trump is clearly using his “Maximum Pressure” negotiating approach with US Trade Representative Lighthizer saying on Friday that “we hope that this leads to further negotiations”. If the US didn’t really want to negotiate, the tariffs would no longer be proposals but would have been implemented long ago. And while Trump is riding high now as he stands tough for American workers, a full-blown escalation into a real trade war with China come the November mid-term elections is not in his interest. This would mean higher prices at Walmart and hits to US agricultural and manufacturing exports both of which will hurt his base and drive a much lower US share market which he has regarded as a barometer of his success. US Congressional leaders may also threaten intervention if they feel Trump’s tariff escalation is getting out of hand. So negotiation is still the aim and China, given its May agreement, is presumably still open to negotiation. So our base case is that after a bit more grandstanding for domestic audiences, negotiations recommence by early July allowing the July 6 tariffs to be delayed as negotiations continue, which ultimately lead to a resolution before the tariffs are implemented. Share markets would rebound in response to this.

But given the escalation in tension and distrust of President Trump we would now only attach a 55% probability to this. The other two scenarios involve:

  • A short-lived trade war with say the tariffs starting up on July 6 and maybe some more but with negotiations resulting in their eventual removal (30% probability). This would likely see more share market downside in the short term before an eventual rebound.

  • A full-blown trade war with China with all US imports from China subject to tariffs and China responding in kind, triggering a deeper 10% decline in share markets on deeper global growth worries (15% probability).

What to watch?

Key to watch for is a return to negotiation between the US and China by the end of June. The renegotiation of NAFTA and proposed retaliation from the EU against US steel and aluminium imports are also worth watching.

Why are Australian shares so relaxed?

Despite the trade war threat Australian shares have pushed to a 10 year high over the last few days helped by a rebound in financial shares, a boost to consumer stocks from the likely passage of the Government’s tax cuts (even though these are trivial in the short term) and strong gains in defensives. Given that China takes one third of our exports the local market would be vulnerable should the trade war escalate significantly. But if our base case (or even a short-lived trade war) plays out the ASX 200 looks on track for our year-end target of 6300.


Source: AMP Capital 21 June 2018

Author: Dr Shane Oliver, Head of Investment Strategy and Chief Economist , AMP Capital

Important note: While every care has been taken in the preparation of this article, AMP Capital Investors Limited (ABN 59 001 777 591, AFSL 232497) and AMP Capital Funds Management Limited (ABN 15 159 557 721, AFSL 426455) makes no representations or warranties as to the accuracy or completeness of any statement in it including, without limitation, any forecasts. Past performance is not a reliable indicator of future performance. This article has been prepared for the purpose of providing general information, without taking account of any particular investor’s objectives, financial situation or needs. An investor should, before making any investment decisions, consider the appropriateness of the information in this article, and seek professional advice, having regard to the investor’s objectives, financial situation and needs. This article is solely for the use of the party to whom it is provided.
Here’s my forecast: “The global economy is going to have a significant downturn and record levels of debt are going to make it worse.” Sound scary enough? Put it in the headline and I can be assured of lots of clicks! I might even be called a deep thinker! The problem is that there is nothing new or profound in this. A significant economic downturn is inevitable at some point (it’s just the economic cycle), debt problems are involved in most economic downturns and such calls are a dime a dozen.

A standard scare now is that memories of the role of excessive debt in contributing to the GFC have worn thin and total global debt has pushed up to a new record high of over $US200 trillion – thanks largely to public debt in developed countries (with more to come in the US as Trump’s fiscal stimulus rolls out), Chinese debt and corporate debt (and household debt in Australia of course). Also, that its implosion is imminent and inevitable as interest rates normalise and that any attempt to prevent or soften the coming day of reckoning will just delay it or simply won’t work. However, in reality it’s a lot more complicated than this. This note looks at the main issues.

Global debt – how big is it and who has it?

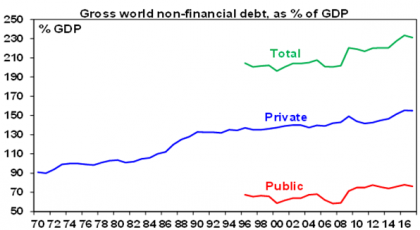
Total gross world public and private debt is around $US171 trillion. Adding in financial sector debt pushes this over $US200 trillion but that results in double counting. Either way it’s a big and scary number. But it needs to be compared to something to have any meaning or context. A first point of comparison is income or GDP at an economy wide level. And even here new records have been reached with gross world public and private non-financial debt rising to a record of 233% of global GDP in 2016, although its fallen fractionally to 231% since. See the next chart.

Gross World non financial debt, as % of GDP 

Source: IMF, Haver Analytics, BIS, Ned Davis Research, AMP Capital

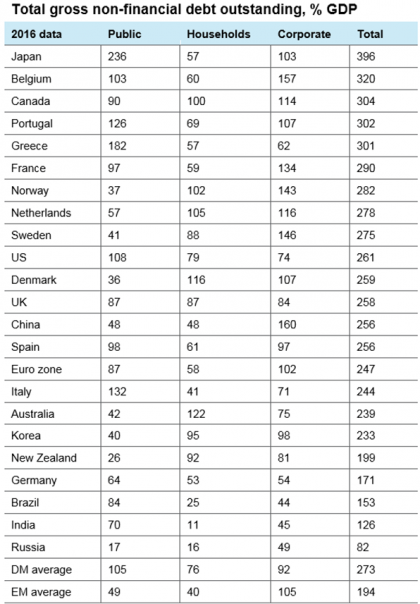
The next table compares total debt for various countries.

Total gross non-financial debt outstanding, % GDP 

Source: IMF, Haver Analytics, BIS, Ned Davis Research, AMP Capital

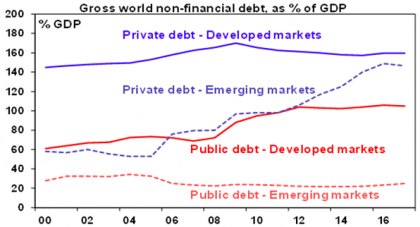
The next chart shows a comparison of developed world (DM) and emerging world (EM) debt – both public and private.

 Gross world non-financial debt, as % of GDP

Source: Haver Analytics, BIS, Ned Davis Research, AMP Capital

It can be seen that the rise in debt relative to GDP since the GFC owes to rising public debt in the developed world and rising private debt in the emerging world. Within developed countries a rise in corporate debt relative to GDP has been offset by a fall in household debt, so private debt to GDP has actually gone down slightly. And a rapid rise Chinese debt (particularly corporate) has played a role in the emerging world.

Of course, it needs to be mentioned that measures of gross debt exaggerate the total level of debt. For example, because of government holdings of debt instruments via sovereign wealth funds, central bank reserves, etc, net public debt is usually well below gross debt. In Norway net public debt is -91% of GDP and in Japan it’s 153% of GDP. But as an overview:

  • Japan, Belgium, Canada, Portugal and Greece have relatively high total debt levels;

  • Germany, Brazil, India and Russia have relatively low debt;

  • Australia does not rank highly in total debt – it has world-beating household debt but low public & corporate debt;

  • Emerging countries tend to have relatively lower debt, but rising private debt needs to be allowed for particularly in China, where corporate debt is high relative to GDP.

The bottom line is that global debt is at record levels even relative to GDP so it’s understandable there is angst about it.

Seven reasons not to be too alarmed about record debt

However, there are seven reasons not to be too alarmed by the rise in debt to record levels.

First, the level of debt has been trending up ever since debt was invented. This partly reflects greater ease of access to debt over time. So that it has reached record levels does not necessarily mean it’s a debt bomb about to explode.

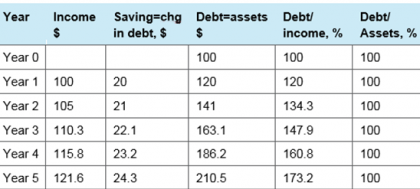
Second, comparing debt and income is a bit like comparing apples and oranges because debt is a stock while income is a flow. Suppose an economy starts with $100 of debt and $100 in assets and in year 1 produces $100 of income and each year it grows 5%, consumes 80% of its income and saves 20% which is recycled as debt and invested in assets. How debt, debt to income & debt to assets evolves can be seen in the next table.

Debt ratios over time
Debt ratios over time 

Source: AMP Capital

At the end of year 1 its debt to income ratio will be 120%, but by the end of year 5 it will be 173%. But assuming its assets rise in line with debt its debt to asset ratio will remain flat at 100%. So the very act of saving and investing creates debt and {% rising debt to income ratios. 1 China is a classic example of this where it borrows from itself. It saves 46% of GDP and this saving is largely recycled through banks and results in strong debt growth. But this is largely matched by an expansion in productive assets. The solution is to spend more, save less and recycle more of its savings via investments like equity. 

Third, the rapid rise in private debt in the emerging world is not as concerning as they have a higher growth potential than developed countries. Of course, the main problem emerging countries face is that they borrow a lot in US dollars and either a sharp rise in the $US or a loss of confidence by foreign investors causes a problem. This has started to be a concern lately as the $US is up 7% from its low earlier this year.

Fourth, debt interest burdens are low and in many cases falling as more expensive, long maturity, older debt rolls off. And given the long maturity of much debt in advanced countries it will take time for higher bond yields to feed through to interest payments. In Australia, interest payments as a share of household disposable income are at their lowest since 2003, and are down by a third from their 2008 high. There is no sign of significant debt servicing problems globally or in Australia.

Fifth, most of the post GFC debt increase in developed countries has come from public debt & governments can tax and print money. Japan is most at risk here given its high level of public debt, but borrows from itself. And even if Japanese interest rates rise sharply (which is unlikely with the BoJ keeping zero 10-year bond yields with little sign of a rise) 40% of Japanese Government bonds are held by the BoJ so higher interest payments will simply go back to the Government.

Sixth, while global interest rates may have bottomed, the move higher is very gradual as seen with the Fed and the ECB, Bank of Japan and RBA are all a long way from raising rates. What’s more, central banks know that with higher debt to income ratios they don’t need to raise rates as much to have an impact on inflation or growth as in the past.

Finally, debt alone is rarely the source of a shock to economies. Broader signs of excess such as overinvestment, rapid broad-based gains in asset prices and surging inflation and interest rates are usually required and these aren’t evident on a generalised basis. But these are the things to watch for.

Concluding comment

History tells us that the next major crisis will involve debt problems of some sort. But just because global debt is at record levels and that global interest rates and bond yields have bottomed does not mean a crisis is imminent. For investors, debt levels are something to remain alert too – but in the absence of excess in the form of booming investment levels, surging inflation and much higher interest rates, for example, there is no need to be alarmed just yet.   


1.  [My favourite example of the complex relationships between income, saving and debt came from Bank Credit Analyst Research. Suppose there is an island with 100 people, each making 100 coconuts a year. Here’s three possibilities.

Case 1: Output is 10,000 coconuts with each person consuming 100. Saving and investment are zero and no debt is created.
Case 2: Each person consumes only 75 coconuts a year, selling the remainder to a plantation who buys them with a bank loan and plants them resulting in 2500 new coconut trees. Consumption is 7500 coconuts. Savings and investment are 2500 and debt has gone up by 2500 coconuts.
Case 3: Each person consumes 125 coconuts, by importing 25 each from foreign islands. Consumption is now 12,500 coconuts, savings is -2500 coconuts, investment is zero and the current account deficit is 2500. External debt goes up by 2500. This gets risky if the other islands want their coconuts back!

So debt can rise even if an economy lives within its means & invests for the future. ] 

Source: AMP Capital 19 June 2018

Important note: While every care has been taken in the preparation of this article, AMP Capital Investors Limited (ABN 59 001 777 591, AFSL 232497) and AMP Capital Funds Management Limited (ABN 15 159 557 721, AFSL 426455) makes no representations or warranties as to the accuracy or completeness of any statement in it including, without limitation, any forecasts. Past performance is not a reliable indicator of future performance. This article has been prepared for the purpose of providing general information, without taking account of any particular investor’s objectives, financial situation or needs. An investor should, before making any investment decisions, consider the appropriateness of the information in this article, and seek professional advice, having regard to the investor’s objectives, financial situation and needs. This article is solely for the use of the party to whom it is provided.
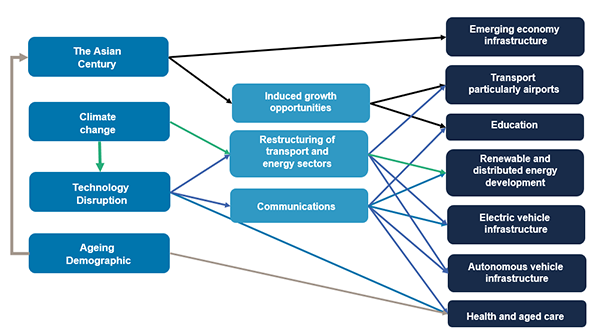
Infrastructure investing is changing fast as evolving global trends throw up new opportunities.

The rise of emerging Asian economies, climate change, technological disruption and the ageing demographic are transforming the demand for essential facilities across the developed world and beyond.

This is creating exciting investment opportunities for infrastructure investors who are examining this expanding asset class to capture global economic growth.

click to enlarge

Source: AMP Capital

The Asian Century

The Chinese middle class has expanded enormously in recent years; from just 4% of its population in 2000, it is expected to reach 75% by 2022 according to McKinsey. Similar trends are becoming evident in India and south-east Asian economies. According to PwC, six of the world’s seven largest economies in 2050 will be current emerging economies; three of the top four being in Asia.

This is already fueling the infrastructure needs of those societies, as evidenced by the Chinese government’s One Belt One Road initiative. Fast rail links, the Hong Kong-Zhuhai-Macau Bridge and upgraded port facilities are all signs of this.

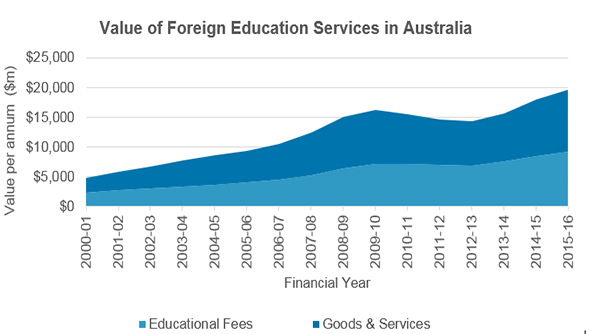
This trend is also impacting developed economies as the Asian middle class spends its new wealth in western countries. A university education in an English-speaking developed country is highly regarded across Asia. Education is now Australia’s largest service export.

This influx of international students is increasing the need for student accommodation attached to leading universities in countries such as Australia. This market expects a higher quality standard than traditional student housing, but its enhanced ability to pay gives rise to long-term high-yield investments that provide protection against inflation.

click to enlarge

Source:ABS 5368.0.55.003

The emerging Asian middle class is also spending its new-found wealth on overseas travel. Long-haul air travel in the Asia Pacific region is forecast to grow in excess of 6% per year over the next 20 years.

Australian international airports have taken advantage of this, achieving some of the highest EBITDA growth amongst developed economy airports. A lack of spare capacity and technological improvements that enable more long-haul direct flights are boosting demand for new infrastructure projects to support this growing demand.

Climate change

The 2015 Paris Climate Change Agreement committed countries to take measures that would limit global warming to 2 degrees Celsius. This promise and the immediate impact of pollution are leading to the restructuring of transport and energy sectors.

Road congestion and pollution are leading to electric vehicles, greater experimentation with road charging, high-speed rail links and the expansion of mass transit networks in large urban areas. Such developments require large-scale construction projects and/or the handling of large volumes of data.

Climate change has also led governments to adjust the incentives that apply to energy supply in favour of renewables at the expense of fossil fuels. The profusion of wind, solar, hydro and tidal projects is well-established, however these are likely to continue to expand as their historic cost disadvantage continues to diminish.

Climate change also represents a challenge for the management and distribution of scarce urban water resources, in which private sector capital may well have a role to play.

Disruptive technology on a micro level is leading to energy cost savings for households when rooftop solar panels are integrated with advanced battery technology and connected to the electricity grid. Individual households have achieved cost savings in excess of 80% of their annual electricity bills through exploiting this technology.

Technology costs are expected to continue to fall, making such systems increasingly viable for the typical home owner. Furthermore, integration with network operations can improve grid productivity and also opens up an alternative power generation opportunity for infrastructure investors.

Technological disruption

Technological disruption is initiating a fourth industrial revolution as devices become automated and connected.

The decentralisation of work, energy and service provision is leading to more home working, energy self-sufficiency and local/home delivery. However these trends require ongoing investment in the data and logistical infrastructure required to support these lifestyle shifts.

Hybrid and electric cars and delivery trucks are already becoming a common sight across developed countries. Electric vehicles will be cheaper for consumers and permit the decarbonising of the transport sector.

Looking further ahead, automated vehicles (which will be overwhelmingly electrically-powered) will eventually deliver a more flexible alternative to conventional public transport methods and private car ownership.

However this will depend upon massive infrastructure capex to support the power and data transmission that will be required for the safe and reliable use of road space.

Ageing Demographic

Global fertility rates have halved since 1955 as much of the world has industrialised and life expectancy has risen in developing countries. However the demographic deficit is impacting low-nominal growth developed countries such as Japan and Italy as well as Russia and China. The size of Japan’s workforce has been declining since 1994 as demographics meet a cultural hesitation towards immigration.

This trend is leading to greater health spending; in the UK some 40% of the state-financed National Health Service is spent on the over-65s, a proportion that will continue to rise. Longer-term aged care facilities will also continue to see increasing demand.

These trends will lead to ongoing infrastructure capex as new facilities are established by both public and private sector providers.

Conclusions

A broad range of high-growth infrastructure investments will be generated by these major global structural themes.

Opportunities are most likely to arise in the transport, energy, data/communications and healthcare sectors.

While some of these opportunities, such as airports, will be quite familiar, others will be new, including disruptive technologies or those found in emerging economies. Sovereign and governance risks in these economies will require careful management and the selection of local partners.

These emerging opportunities will provide infrastructure investors with potentially higher returns (and potentially higher risks) which will complement conventional infrastructure investments. Success will depend upon good project selection and high levels of positive control to allow active ‘private equity-style’ asset management of investments.

The blending of higher return “new infrastructure” and traditional infrastructure will allow portfolio managers the ability to construct portfolios with a wide range of risk and return characteristics.


Source: AMP Capital 13 June 2018

Author: John Julian, Portfolio Manager, Core Infrastructure Fund

Important note: While every care has been taken in the preparation of this article, AMP Capital Investors Limited (ABN 59 001 777 591, AFSL 232497) and AMP Capital Funds Management Limited (ABN 15 159 557 721, AFSL 426455) makes no representations or warranties as to the accuracy or completeness of any statement in it including, without limitation, any forecasts. Past performance is not a reliable indicator of future performance. This article has been prepared for the purpose of providing general information, without taking account of any particular investor’s objectives, financial situation or needs. An investor should, before making any investment decisions, consider the appropriateness of the information in this article, and seek professional advice, having regard to the investor’s objectives, financial situation and needs. This article is solely for the use of the party to whom it is provided.
Dermot Ryan, Portfolio Manager, Australian Equites, AMP Capital

Resource companies are enjoying a resurgence in profits based on higher commodity prices and lower unit costs.

Now many of you might think, “well we’ve had booms before.” The big difference this time is that there is still a strong focus on reducing the price of production, even as prices for raw commodities continues to increase. 

In the mining boom pre-Global Financial Crisis (GFC) we saw a sharp run up in commodity prices, and companies scrambling over one another to get mines built as quick as possible – irrespective of costs. This led to greenfield expansion and large amounts of money being spent on labour, machinery and procurement and many of these didn’t get a good cost outcome.

Now, I think we are in one of the best periods for franked returns in the mining industry since the that last boom.

It is refreshing to see, in so many cases, mining companies returning money to investors through dividends and buybacks, rather than just being on a mad rush for growth.

Economic Growth

Global economic growth is running hot. In the US, business confidence and employment growth have been rising, and in much of Europe the recovery is underway.

From China, the world’s biggest commodities consumer, we are seeing a lot of demand for seaborne high-grade commodities, and they are also looking to improve their air quality and the environment, which means there may well be a substitution of lower grade Chinese raw materials for higher grade imports. 

I think there are interesting opportunities across areas such as energy, iron ore, copper, and also specifically commodities related to electric vehicles. Lithium producers are the biggest winners from this, and there is also strong demand for cobalt and graphite.

As we go through this point in the cycle where demand is still high and interest rates haven’t yet risen there is an opportunity for companies that have de-geared their balance sheets to use some of that capital to invest back into their mines.

Mining expansion rarely comes cheap and the Reserve Bank of Australia has kept interest rates on hold for 21 months now. AMP Capital does not expect a rate rise until 2020. However, should the US Federal reserve raise rates quickly there could be risks for commodity prices and Asia demand.

Mining stock values

Valuations are still quite reasonable in the mining space as well because people want to see how sustainable commodity prices are at this level. It wasn’t that long ago after all, that larger companies found themselves too heavily in debt and struggling to refinance during the GFC.

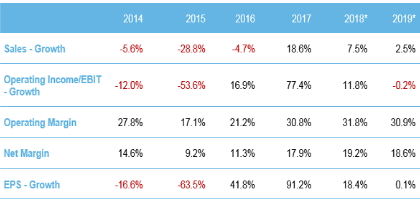
Revenue & Earnings for the Australian Metals and Mining industry group

* Forecast estimates only for 2018 and 2019.  Actual future results could differ materially from any forecasts, estimates, or opinions.
Source: Factset Industry Consensus Estimates

The winners are those who can add incremental production to existing plants and reduce their unit costs per commodity and come down the cost curve. This particularly favors companies with expandable tier one assets.

Now, we seem to be in a more considered period where most moving factors point towards better returns at any given commodity prices. This is really encouraging for Australian investors.

Companies too are much more focused on capital allocation and returning cash to shareholders. These periods of high dividends in deeply cyclical sectors like mining don’t last forever but can be enjoyed by investors in the current market.


Source: AMP Capital 13 June 2018

Author: Dermot Ryan, Portfolio Manager, Australian Equites, AMP Capital

Important note: While every care has been taken in the preparation of this article, AMP Capital Investors Limited (ABN 59 001 777 591, AFSL 232497) and AMP Capital Funds Management Limited (ABN 15 159 557 721, AFSL 426455) makes no representations or warranties as to the accuracy or completeness of any statement in it including, without limitation, any forecasts. Past performance is not a reliable indicator of future performance. This article has been prepared for the purpose of providing general information, without taking account of any particular investor’s objectives, financial situation or needs. An investor should, before making any investment decisions, consider the appropriateness of the information in this article, and seek professional advice, having regard to the investor’s objectives, financial situation and needs. This article is solely for the use of the party to whom it is provided.
Driven by falling markets in Sydney and Melbourne, national house prices fell 0.1% in May, according to figures from property analytics group Core Logic. For the year from 31 May 2017 to 31 May 2018, prices were down 0.4% marking the first annual fall since October 20121.

But AMP Capital’s Head of Investment Strategy and Economics and Chief Economist Dr Shane Oliver says despite the falls, talk of a property market crash is overdone.

Sydney and Melbourne

Prices in Sydney fell 0.2% in May, while Melbourne prices fell 0.5%. In Sydney, the median house price is now $871,454 while in Melbourne it sits at $717,0202.

And depending on whether you’re a buyer or seller in those market, there’s more good or bad news to come.

“We expect prices in Sydney and Melbourne to fall another 4% or so this year, another 5% next year and to still be falling in 2020. Overall, Sydney and Melbourne are likely to see a top-to-bottom fall of around 15% spread out to 2020,” Shane says.

But in the other capital cities, where the housing markets haven’t boomed in recent years to the same extent as Sydney or Melbourne, the forecast is different.

Perth, Darwin and Canberra

Prices in Perth and Canberra were both down 0.1% in May, while Darwin prices were down 0.2%3.

However, all three markets are up for the quarter, and Shane says that prices in Perth and Darwin look to be at or close to bottoming, while Canberra is likely to see moderate price growth in the months to come.

Hobart

Still the star performer, Hobart property continued its upwards surge in May, rising another 0.8%. Prices there are up 12.7% for the year from 31 May 2017 to 31 May 20184.

“The Hobart market remains very strong and the boom in Hobart is likely to continue for a while yet,” Shane says.

Brisbane and Adelaide

In Brisbane property prices rose 0.2% in May, while in Adelaide they performed even better, up 0.5%, with Shane forecasting more moderate price growth to come for both of these cities5.

Regional areas v capital cities

Taken as a whole, the combined capital cities markets fell 0.2% in May, but regional locations are performing better – when combined, regional markets saw prices rise by 0.2% in May, with Geelong and Ballarat in Victoria, the Southern Highlands, Newcastle and Coffs Harbour in NSW and Queensland’s Sunshine Coast among the best performers6.

“Home prices in regional centres are likely to hold up better with continuing modest growth as, generally speaking, they haven’t had the same boom as Sydney and Melbourne and so offer much better value and much higher rental yields,” Shane says.

What’s driving the property market?

Shane says that a combination of factors is behind the falling markets, including: 

  • Investors, people looking for interest-only loans and borrowers with constrained incomes and high expenses finding it more difficult to get finance, as banks have tightened their lending criteria due to pressure from regulators,

  • Tougher restrictions being imposed on foreign buyers by state and federal governments, 

  • Rising levels of housing supply, and

  • Buyers with more realistic price expectations.

Shane says that interest rates are likely to remain at their current levels until 2020 but adds that with “home price weakness at levels where the Reserve Bank of Australia started cutting rates in 2008 and 2011, we can’t rule out the next move in rates being a cut rather than a hike”.

He says that unless interest rates or unemployment unexpectedly skyrocket talk of a property market crash has been overdone.

Please contact us on Phone: 07 5641 4134if you seek further assistance .

1-6 Core Logic, Hedonic Home Value Index, May 2018.

Source : AMP 6 June 2018 

Important 
 
This article provides general information and hasn’t taken your circumstances into account. It’s important to consider your particular circumstances before deciding what’s right for you. Although the information is from sources considered reliable, we do not guarantee that it is accurate or complete. You should not rely upon it and should seek qualified advice before making any investment decision. Except where liability under any statute cannot be excluded, we do not accept any liability (whether under contract, tort or otherwise) for any resulting loss or damage of the reader or any other person.

It seems there is constant hand wringing about the risks around the Chinese economy with the common concerns being around unbalanced growth, debt, the property market, the exchange rate and capital flows and a “hard landing”. This angst is understandable to some degree. Rapid growth as China has seen brings questions about its sustainability. And China is now the world’s second largest economy, its biggest contributor to growth and Australia’s biggest export market so what happens in China has big ramifications globally. But despite all the worries it keeps on keeping on and recently growth has been relatively stable. This note looks at China’s growth outlook, the main risks and what it means for investors and Australia.

Stable growth, benign inflation

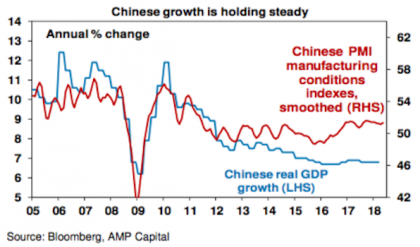
Chinese growth slowed through the first half of this decade culminating in a growth and currency scare in 2015 which saw Chinese policy swing from mild tightening towards stimulus. This has seen pretty stable growth since 2016 of around 6.8% year on year. Consistent with this, business conditions PMIs have also been stable (see the next chart) and uncertainty around the Renminbi has fallen & capital outflows have slowed.


Source: Bloomberg, AMP Capital

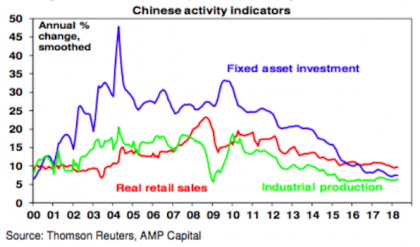
April data saw industrial production and profits accelerate but investment and retail sales slow a bit. Electricity consumption, railway freight and excavator sales have lost momentum from their highs. But the overall impression is that growth is still solid.


Source: Bloomberg, AMP Capital

While there is a need for China to rebalance its growth away from investing for exports, the slowdown in investment growth to below that for retail sales, imports growing faster than exports and the shrinkage in China’s current account deficit from 10% of GDP to 1% of GDP suggests this occurring.

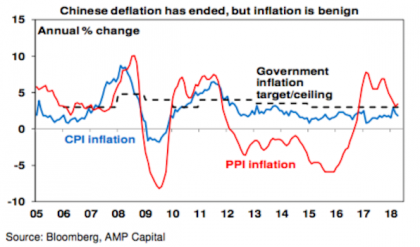
Meanwhile, inflation in China is benign with producer price inflation around 3% and consumer price inflation around 2%.


Source: Domain, AMP Capital

Policy neutral

Chinese economic policy has been relatively stable recently. There has been some talk of boosting domestic demand and bank required reserve ratios have been cut. But the latter appears to have been to allow banks to repay medium term loan facilities, interest rates have been stable and growth in public spending has been steady at 7-8% year on year.

Growth and inflation outlook

We expect Chinese growth this year to slow a bit as investment slows further to around 6.5% and consumer inflation of 2-3%.

Key risks facing China

There are four key risks facing China. First, the policy focus could shift from maintaining solid growth to speeding up medium-term economic reforms and deleveraging (or cutting debt ratios) that could threaten short-term economic growth. Some expected this to occur after the 19th National Congress of the Communist Party was out of the way late last year. And the removal of term limits on President Xi Jinping could arguably make him less sensitive to a short-term economic downturn. However, so far there is no sign of this and the authorities seem focused on maintaining solid growth.

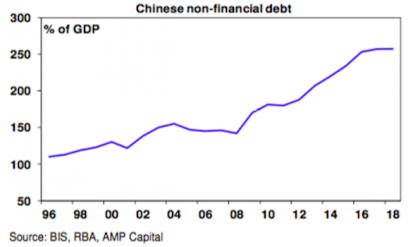
Second, China’s rapid debt growth could turn sour. Since the Global Financial Crisis, China’s ratio of non-financial debt to GDP has increased from around 150% to around 260%, which is a faster rise than has occurred in all other major countries.


Source: RBA, AMP Capital

This has been concentrated in corporate debt and to a lesser degree household debt and has been made easier by financial liberalisation and a lot of the growth has been outside the more regulated banking system in “shadow banking”. An obvious concern is that when debt growth is rapid it results in a lot of lending that should not have happened that eventually goes bad. However, China’s debt problems are different to most countries. First, as the world’s biggest creditor nation China has borrowed from itself – so there’s no foreigners to cause a foreign exchange crisis. Second, much of the rise in debt owes to corporate debt that’s partly connected to fiscal policy and so the odds of government bailout are high. Finally, the key driver of the rise in debt in China is that it saves around 46% of GDP and much of this is recycled through the banks where it’s called debt. So unlike other countries with debt problems China needs to save less and consume more and it needs to transform more of its saving into equity rather than debt. Chinese authorities have long been aware of the issue and growth in shadow banking and overall debt has slowed but slamming on the debt brakes without seeing stronger consumption makes no sense.

Third, the risk of a trade war has escalated with Trump threatening tariffs on $50-150bn of imports from China and restrictions on Chinese investment in the US and China threatening to reciprocate. While “constructive” negotiations have commenced and have seen China commit to buying more from the US & to strengthen laws protecting intellectual property which saw the US initially defer the tariffs and restrictions, Trump has indicated that they will be implemented this month which looks to be aimed at prodding China to move rapidly (and appeasing his base). Ultimately, we expect a negotiated solution, but the risks are high and a full-blown trade war with the US could knock 0.5% or so off Chinese short-term growth.

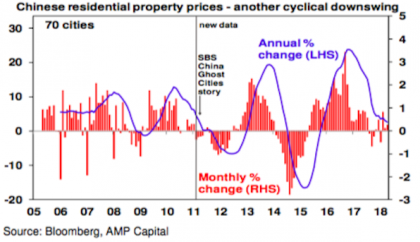
Finally, with the Chinese residential property market slowing again there is naturally the risk that this could turn into a slump. It’s worth keeping an eye on but absent an external shock looks doubtful. The “ghost cities” paranoia of a few years ago – it first aired on SBS TV way back in 2011 – has clearly not come to much. It’s doubtful China ever really had a generalised housing bubble: household debt is low by advanced country standards; house prices haven’t kept up with incomes; and while there’s been some excessive supply, this is not so in first tier cities; and the quality of the housing stock is low necessitating replacement. So, I think the property crash fears continue to be exaggerated and the latest bout of weakness in prices looks to be just another cyclical downswing in China of which there have been several over the last decade.


Our assessment remains that these risks are manageable, albeit the trade war risk is the hardest for China to manage given the erratic actions of President Trump. The Chinese Government has plenty of firepower to support growth though, so a “hard landing” for Chinese growth remains unlikely for now.

The Chinese share market

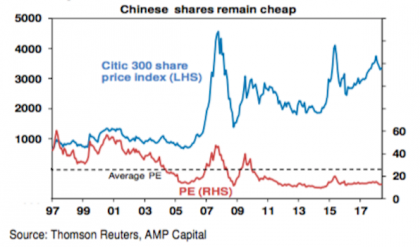
Since its low in January 2016 the Chinese share market has had a good recovery. But Chinese shares are trading on a price to earnings ratio of 12.8 times which is far from excessive.

With valuations okay and growth continuing, Chinese shares should provide reasonable returns, albeit they can be volatile.

Implications for Australia – not yet 2003, but still good

Solid growth in China should help keep commodity prices, Australia’s terms of trade and export volume growth reasonably solid. This, along with rising non-mining investment and strong public investment in infrastructure, will offset slowing housing investment and uncertainty over the outlook for consumer spending and will keep Australian economic growth going. However, with strong resources supply (and still falling mining investment) we are a long way from the boom time conditions of last decade and growth is likely to average around 2.5-3%. Rising US interest rates against flat Australian rates suggests more downside for the $A, but solid commodity prices should provide a floor for the $A in the high $US0.60s.

Key implications for investors

  • Chinese shares remain reasonably good value from a long- term perspective, but beware their short-term volatility.

  • Solid Chinese growth should support commodity prices and resources shares


Source: AMP Capital 04 June 2018

Important note: While every care has been taken in the preparation of this article, AMP Capital Investors Limited (ABN 59 001 777 591, AFSL 232497) and AMP Capital Funds Management Limited (ABN 15 159 557 721, AFSL 426455) makes no representations or warranties as to the accuracy or completeness of any statement in it including, without limitation, any forecasts. Past performance is not a reliable indicator of future performance. This article has been prepared for the purpose of providing general information, without taking account of any particular investor’s objectives, financial situation or needs. An investor should, before making any investment decisions, consider the appropriateness of the information in this article, and seek professional advice, having regard to the investor’s objectives, financial situation and needs. This article is solely for the use of the party to whom it is provided.
With the ATO keeping a close eye on deductions, make sure you’re across what you can and can’t claim.

If you’re claiming back some of the money you’ve spent as part of your job this year, it’s a good idea to ensure you’ve kept the appropriate records that may be required ahead of lodging your tax return.

The Australian Taxation Office (ATO) said recently Aussies needed to keep the necessary records, adding that it would be paying close attention to claims made for certain work-related expenses1.

If you’re not really sure what you should be claiming, here’s a rundown on what you should know.

What is a legitimate deduction?

When completing your tax return for the financial year (1 July 2017 to 30 June 2018), you’re able to claim deductions for some expenses, most of which will be directly related to you earning an income.

The main thing to remember is a work-related expense is only deductible if2:

  • you paid for it and were not reimbursed by your employer

  • it relates to you earning an income and was not for personal use

  • you have a record, such as a receipt.

Note, if the total amount you’re claiming is $300 or less, you generally won’t need receipts, unless your claim relates to car expenses, meal allowances, award transport payments, or travel3.

However, you may be asked to tell the ATO how your claim was worked out and explain why the claim is reasonable, based on the requirements of your occupation.

What if expenses are related to work and personal use?

If your expenses are for both work and personal use, you can only claim a deduction for the work-related portion, which could for instance be 50% of your phone and internet bundle.

Another example is say you go on an overseas study trip, but are taking a holiday at the same time, you wouldn’t be able to claim the entire trip as a work-related expense.

What are some typical examples of things you can claim?

Below are some common examples of tax-deductible work expenses and for more information, including deductions for specific industries and occupations, check out the ATO website.

  • Vehicle and travel expenses (which generally won’t include travel between work and home)

  • Clothing, laundry and dry-cleaning expenses (which typically only applies if you wear occupation-specific clothing or a uniform)

  • Home office expenses (such as computer, phone and internet costs, but only the proportion that relates to work and not your own personal use)

  • Self-education expenses relevant to your job (such as course fees, textbooks and journals)

  • Tools and equipment (such as sunscreen and sunglasses if you work outside, or laptop and relevant software if you work in an office)

  • Other deductions (which might include things like union fees).

Meanwhile, remember there are other things outside of work that you may be able to claim, such as personal super contributions, interest, dividend and other investment-related income deductions, as well as gifts and donations to deductible gift recipients.

Is there any help to make tax time easier?

You can use the myDeductions tool in the ATO app to save a record of your deductions throughout the financial year, which you can upload when you do your tax return or provide to your tax agent, who may be able to provide you with additional tips if your tax situation is a bit more complex.

To ensure you’ve got all the relevant information you need ahead of filing your tax return, check out the ATO’s tax time checklist. And, keep in mind, if you’re lodging your own tax return, you have until 31 October 2018 to lodge it, or potentially longer if you’re using a registered tax agent.

Please contact us on Phone: 07 5641 4134 if you seek further assistance  

Source : AMP May 2018

ATO media release – Australians on notice to keep their receipts
ATO – Deductions you can claim paragraph 2
ATO – Work related expenses Rules for written evidence to substantiate deductions

Important 
 
This article provides general information and hasn’t taken your circumstances into account. It’s important to consider your particular circumstances before deciding what’s right for you. Although the information is from sources considered reliable, we do not guarantee that it is accurate or complete. You should not rely upon it and should seek qualified advice before making any investment decision. Except where liability under any statute cannot be excluded, we do not accept any liability (whether under contract, tort or otherwise) for any resulting loss or damage of the reader or any other person.

Little things can make a big difference to how long your money lasts in retirement.

When it comes to retirement planning, you’ll want to make the most of your money, after all you don’t want to fritter away the savings you’ve worked all your life to achieve. So, whether you’re living a comfortable or modest lifestyle in retirement, there are still ways to make your money go further in retirement and make every dollar count.

Here are five things to consider:

1. Sell your second car

If it’s not critical to your daily routine, not only could you top up your savings with the sale proceeds, but you will save on annual registration, insurance and maintenance costs. Find out which concessions are available to you in your state to travel by public transport. Or catch a taxi occasionally as it will still be cheaper than maintaining a second car.

2. Renegotiate your bills

Check with your providers about bundling to save on services such as technology (phone, broadband), and energy (electricity, gas). Or check other providers’ rates through comparison websites. Ask if your provider offers a pensioner or seniors discount and then put what you save towards other expenses.

3. Investigate discounts and rebates

Visit the Department of Social Services or the Department of Veterans’ Affairs websites to learn about benefits and payments, such as pensions, allowances, bonuses, concession cards, supplements and other services you can access. Or find out about the Seniors Card for discounts on travel, health, lifestyle, government services and finance in your state. 

4. Save on groceries

Do some research online to check for sales, half-priced or discounted items before you go shopping. You can also buy in bulk and then share the costs with your neighbours or family. Remember to check details such as use-by dates and the policy on returning items, as well as how and when you can take delivery of your groceries if you buy online. 

5. Put your bills onto direct debit

You can have your bills paid automatically from your bank account by setting up a direct debit. Most suppliers have this facility, so go online, check your bill or ring your provider to get the details. If you normally pay your bills in person, you’ll save time and effort by not travelling to the post office (or wherever you pay your bills). And this way, you’ll qualify for the pay on time discounts that some providers offer, and you won’t have to check your bills tray every day to remember to pay them when they’re due.

How long will your money need to last?

These days we need to look after our finances for much longer than we’ve had to in the past.

Now, if you’re a male aged 65, you could expect to live for another 19 years (to age 84) while a 65 year old woman’s life expectancy is 87 – which is around 30 years longer than our Aussie ancestors of the 1800s.1

So it’s important to make sure your funds will last the distance – both now and in the future. Please contact us on Phone: 07 5641 4134 if you seek further assistance .

1 Australian Government, Australian Institute of Health and Welfare, Life expectancy, paragraph 3, 5.

Source : AMP 28 May 2018 

Important 
 
This article provides general information and hasn’t taken your circumstances into account. It’s important to consider your particular circumstances before deciding what’s right for you. Although the information is from sources considered reliable, we do not guarantee that it is accurate or complete. You should not rely upon it and should seek qualified advice before making any investment decision. Except where liability under any statute cannot be excluded, we do not accept any liability (whether under contract, tort or otherwise) for any resulting loss or damage of the reader or any other person.

It’s not just those aged 20 to 24 living at home – about 5% of people 40 and over are also sharing a roof with mum and dad.

I recently came across a news story about a hapless New York couple, who have taken their 30-year old son to court in a last-ditch effort to get him to move out of home. My first thought was “only in America”. But here in Australia, high rents and low housing affordability are seeing plenty of parents shelve plans for an empty-nester lifestyle as their 20-, 30- and even 40-something offspring show no signs of leaving the family home.

Research by Finder shows 40% of 20 to 24 year-olds still live at home, and even one in ten 30-somethings, and about 5% of people aged 40-plus still share a roof with mum and dad.

When does the rent-free ride stop?

Many parents relish having their children at home for longer, and there is a whole variety of reasons why multi-generation living is becoming more commonplace in Australia – anything from cultural norms to rising rents. While it can be unfair for one generation to shoulder the financial burden of many heads living under one roof, the issue of whether or not to charge adult children board can be very contentious.

Finder found some parents say the rent-free ride should stop when children turn 19. One in five believe their child should pay board when they land a job, and a similar proportion of parents is against the idea of charging board altogether.

The thing is, parents can be fantastic teachers when it comes to helping kids of any age manage their money and learn to live within their means to enjoy a financially sustainable future. Sure, if your son or daughter is studying or in an apprenticeship, they probably don’t have much cash to spare. But continually providing a free ride when your kids are earning an independent income can encourage an artificial view of how the world works.

More to the point, shelling out for adult kids can prove a drain on parents’ finances at a time when they are nearing retirement.

A stepping stone to independence

Charging your children board – even just a small amount, when they have the capacity to pay, is a stepping stone towards adulthood. And for parents who could be looking at spending 20 or more years in retirement, every bit helps to stretch their own money further.

If you’d prefer your adult child to start paying their way, try to approach the subject with tact. No one enjoys a surprise announcement that they’re suddenly expected to cough up cash on a regular basis. But be firm. However much you choose to charge, it is important that board is paid regularly. This sends a strong message that bills need to be paid on time, and they need to be paid first, ahead of life’s luxuries. Surely that is an essential life lesson we should pass onto our kids!

Source : AMP May 2018 

Paul Clitheroe is Chairman of the Australian Government Financial Literacy Board and chief commentator for Money Magazine.

Important 
 
This article provides general information and hasn’t taken your circumstances into account. It’s important to consider your particular circumstances before deciding what’s right for you. Although the information is from sources considered reliable, we do not guarantee that it is accurate or complete. You should not rely upon it and should seek qualified advice before making any investment decision. Except where liability under any statute cannot be excluded, we do not accept any liability (whether under contract, tort or otherwise) for any resulting loss or damage of the reader or any other person.


The end of the financial year will likely bring the usual wave of scams. Here’s what to look for.

The Federal Budget is behind us, and amid the celebrations over tax cuts (around $500 annually for low to middle income earners if proposals are legislated), now is the time to be mindful of scammers pretending to be from government bodies – especially the Australian Taxation Office (ATO). In some cases, scam victims have lost close to $1 million dollars.

Beware scams posing as ASIC

If previous years are anything to go by, the end of the financial year will bring the inevitable wave of scams. Money watchdog the Australians Securities and Investment Commission (ASIC) for instance, has recently warned about crims posing as ASIC representatives asking victims to pay bogus fees. They often make contact via email, accompanied by an invoice that infects your computer with malware if you click the link.

Protect yourself by looking for warning signs that show an email isn’t from ASIC at all. The clues include requests to make a payment in order to receive a refund, or if the email asks directly for your credit card or bank details.

Dodgy emails seeming to come from the ATO

More worrying, the ATO has recently advised that scammers are leaving voicemail messages on their victims’ phones, threatening the recipient with arrest due to an unpaid tax debt or suspected tax evasion. It can be scary stuff for those on the receiving end.

Scammers are also sending fake emails asking for completion of a ‘tax refund review’ form to allow recipients to receive a refund. Apparently, the form asks for online banking details, credit card numbers (and even credit limits) as well as your personal address. The ATO is warning not to click on or save any attachments as they may download malicious malware. Above all, do not disclose the personal information the form is requesting.

Scam victims can pay dearly

Not surprisingly, many people are taken in by these scams, and in previous years up to 48,000 people have reported coming across these scams between the peak tax-time months of July and October.

Hundreds of Australians have collectively handed over millions of dollars to scammers with one victim losing $900,000 borrowed from friends and family. Others have handed over personal details such as tax file numbers, which can lead to identity theft.

Protect yourself – and your money

In many cases, scam emails are easily spotted. Hover your computer’s mouse over the email address of the sender and it will show the true source. Have a close look through the email, and you’ll typically find that scam messages are poorly written with some pretty obvious spelling mistakes. The email may ask you to click what appears to be a link to the ATO website but when you hold the mouse over the link, it won’t have the official ato.gov.au address.

If you are unsure if a phone call or voicemail is from the tax man, call the ATO on 1800 008 540.

Better still, contact us on Phone: 07 5641 4134 before 30 June to connect with a reputable accountant or tax adviser, who could be a valued source of reassurance if you find yourself crossing paths with a scammer.

Paul Clitheroe is Chairman of the Australian Government Financial Literacy Board and chief commentator for Money Magazine.

Source : AMP 10 May 2018 

 
Important 
 
This article provides general information and hasn’t taken your circumstances into account. It’s important to consider your particular circumstances before deciding what’s right for you. Although the information is from sources considered reliable, we do not guarantee that it is accurate or complete. You should not rely upon it and should seek qualified advice before making any investment decision. Except where liability under any statute cannot be excluded, we do not accept any liability (whether under contract, tort or otherwise) for any resulting loss or damage of the reader or any other person.