By Flying Solo contributor Lucinda Lions

Have you ever said to yourself, “That’s a great idea, I don’t need to write it down,” only to regret your decision within 17.7 seconds? Here’s a quick, easy way to remember names, numbers and everyday information.

Is this you?

Have you ever been driving along and tried to memorise a website or business name, to no, frustrating, avail?

Have you ever spell-checked a word online so many times that Google voluntarily and independently shows you memory loss ads, abandoning its algorithm in order to salvage yours?

Have you ever been introduced to someone, instantly forgetting their name while secretly grasping for your own?

If you answered ‘yes’ to any of these questions, you may find this article memorable, for all the right reasons.

To be clear, I’m no expert in memory. Heck, if I remember my age, it’s a good day. But an event happened recently that prompted me to take a hard look at why I should attempt to improve my memory skills.

“These numbers became seared into my memory within minutes, and now I literally can’t forget them. Yet, I had been struggling to memorise them for months.”

I should have remembered this

I had been struggling to remember the last three digits of my son’s mobile phone number for ages, which became an issue one day when my phone battery died and I had to call him using someone else’s phone.


But I couldn’t remember his full number, only the first seven digits.  I couldn’t call him. Yikes!

Thankfully everything worked out, but it so easily may not have. The incident pushed me to learn more about my memory, or lack thereof, as well as the best techniques to help me remember stuff.

This is what I found out.

Baker versus baker

I watched an excellent Ted Talk by Joshua Foer on memory.  In it, Foer explains that all memory techniques come down to ‘elaborate encoding’, which involves trying to remember abstract information (such as the numbers 417) by making them relatable and meaningful, therefore memorable. Elaborate encoding is illustrated perfectly by the Baker/baker Paradox.

The paradox goes like this.

If I said to you, “Remember that there’s a guy who is a baker”, and I said to your friend, “Remember that there’s a guy by the name of Baker”, YOU are more likely to remember the word ‘baker’ than your friend.

The reason? The name Baker probably doesn’t actually mean anything to your friend. As Foer explains, the word Baker is ‘untethered to all the other memories floating around’ in his skull. But a baker, on the other hand, triggers visual images of people in white hats with floury hands. So when you hear about a baker, your brain starts sinking ‘associational hooks’ into the word, making it easier to fish out later.

When it comes down to it, Foer says that the art of trying to remember information well, is about figuring out how to change capital case Bakers into lower case bakers. In other words, turning all abstract information into interesting, relatable, memorable information.

Foer also describes our minds as being a palace: “As bad as we are at remembering names and numbers and word-for-word instructions from our colleagues, we have really exceptional visual and spatial memories… The idea behind the memory palace is to create this imagined edifice in your mind’s eye and populate it with images that you want to remember. The crazier, weirder, more bizarre, funnier, raunchier, stinkier the image is, the more unforgettable it’s likely to be.”

I put it into practice

Straight after watching the Ted Talk, I created the below image in my head of the last three digits of my son’s phone number.  I turned the abstract, impersonal numbers into a visual, memorable cartoon.

I imagined that the number four was climbing up a long rope that looked like the number one, and the number seven was a platform, just above the rope.

These numbers became seared into my memory within minutes, and now, I literally can’t forget them. Yet, I had been struggling to memorise them for months.

 

You’ve probably been doing this all your life

Like me, you’ve probably been using Mnemonics for ages. (Oh yeah, now’s a good time to explain this funny word.  Mnemonics is pronounced ‘ne-monics’, we have to remember that the ‘m’ is silent – cruel!  Mnemonics are creative memory techniques that help us retain and retrieve information; techniques such as songs, rhymes, poems, acronyms, images and more.)

What Foer’s Ted Talk did, was jog my memory and remind me to continue using these mnemonics, rather than falling into the nasty habit of wrongly assuming I can’t remember stuff.

This is what I mean.

Yesterday when I automatically Googled whether to use ‘bare’ instead of ‘bear’ (in relation to ‘bearing’ a burden), as I’ve done several times before; I stopped and took the time to create a memory hook instead, so I’d never have to look up the word again. I imagined a bear carrying a cumbersome cross, which now reminds me that a bear must bear the heavy burdens. And as for ‘bare’ meaning naked, I now imagine that the letters ‘b’ and ‘a’ look like breasts. (I’ll spare you the cartoon of that visual image!)

Time and practise

I think a lot of this memory work comes down to time, inclination, practise and habit.

Am I willing to invest the time to remember something, even if it takes just a few seconds? Am I actually interested in retaining a piece of information? Will I make it a habit? Am I going to regularly practise until I get better at it? (I recently tried to remember a lovely lady’s name using a memory hook, and I stuffed it up remarkably. The lady’s unusual and beautiful name was Kofee, and I said, “Bye Cocoa”. I felt terrible!)

To be honest, I’m not sure if I’ll get into the daily memory-practicing habit, though Kofee probably thinks I should! At least I know there are techniques out there for all ‘417’ situations.

There’s no such thing as a brilliant memory

The good news is, there’s no such thing as a God-given brilliant memory, just brilliant ways to remember information. And the great news is that these memory techniques are accessible to all of us. Now, that’s good to remember!

Source : FlyingSolo September 2018 


This article by Lucinda Lions is reproduced with the permission of Flying Solo – Australia’s micro business community. Find out more and join over 100K others


Important:
This provides general information and hasn’t taken your circumstances into account. It’s important to consider your particular circumstances before deciding what’s right for you. Any information provided by the author detailed above is separate and external to our business and our Licensee. Any information provided by the author detailed above is separate and external to our business and our Licensee. Neither our business, nor our Licensee take any responsibility for any action or any service provided by the author.

Any links have been provided with permission for information purposes only and will take you to external websites, which are not connected to our company in any way. Note: Our company does not endorse and is not responsible for the accuracy of the contents/information contained within the linked site(s) accessible from this page.


Are you feeling wealthier, less wealthy or somewhere in between? You may be experiencing what is sometimes called “the housing wealth effect”.

Movements in house prices, up and down, can affect how we feel about the state of our wealth and our willingness to spend, suggests a Reserve Bank paper* published several years ago.

Under this theory, if house prices are up, we may tend to feel wealthier and willing to spend more on consumer goods including new cars. And when house prices are weakening, we may tend to feel less wealthy and less willing to spend as freely.

As housing prices have continued to weaken in most Australian states, led by Sydney and Melbourne, you may decide to reduce your consumer spending due to the housing wealth effect. And you may be more inclined to save more in such ways as accelerating your mortgage repayments.

While overall new car sales have eased over the year to August, sales of luxury cars are at their lowest for more than two years, according to an update of the CommSec Luxury Vehicle Index. This index is based on the Australian sales of 17 upmarket models.

Historically-low interest had been, of course, a major driver of the last rapid rise in housing prices. (The Reserve Bank this month held the official cash rate at the record low of 1.5 per cent – a level held for almost two years.)

Yet continuing low rates provide an opportunity for many homebuyers, depending upon their circumstances, to build a mortgage buffer or cushion using mortgage offset accounts and redraw facilities.

By putting aside more than the required mortgage payment, homebuyers create protection to help deal with financial setbacks, such as illness or job loss, and future rate rises.

When interest rates fell over the past decade, many homebuyers chose to keep their monthly repayments at the same dollar amount while many developed a habit of making higher repayments whenever possible.

The Reserve Bank reports that homebuyers early this year held a total in mortgage offset accounts and redraw facilities equal to two and a half years of scheduled repayments.

Particularly given Australia’s record household debt, it makes much sense for homebuyers to try to use the “housing wealth effect” to their advantage by building a bigger mortgage buffer – a task made more achievable by low interest rates.

In a speech this month, the Reserve Bank continued to highlight the rise in household debt – up from 70 per cent of household income in the early 1990s to 190 per cent today. Australia’s total household debt-to-income ratio has been rising in recent years more sharply than in other advanced economies.

The rise in household debt is “largely due” to a rise in mortgage debt, the Reserve Bank notes. Low interest rates have enabled homebuyers to borrow more – a key influence in a country of enthusiastic homeowners.

* Housing wealth effects: Evidence from new vehicle registrations, Reserve Bank Bulletin, September 2015.

Written by Robin Bowerman, Head of Corporate Affairs at Vanguard.

Please contact us on Phone: 07 5641 4134 if you seek further assistance on this topic.

Source : Vanguard September 2018

Reproduced with permission of Vanguard Investments Australia Ltd

Vanguard Investments Australia Ltd (ABN 72 072 881 086 / AFS Licence 227263) is the product issuer. We have not taken yours and your clients’ circumstances into account when preparing this material so it may not be applicable to the particular situation you are considering. You should consider your circumstances and our Product Disclosure Statement (PDS) or Prospectus before making any investment decision. You can access our PDS or Prospectus online or by calling us. This material was prepared in good faith and we accept no liability for any errors or omissions. Past performance is not an indication of future performance.

© 2018 Vanguard Investments Australia Ltd. All rights reserved.

Important:
Any information provided by the author detailed above is separate and external to our business and our Licensee. Neither our business, nor our Licensee take any responsibility for any action or any service provided by the author.

Any links have been provided with permission for information purposes only and will take you to external websites, which are not connected to our company in any way. Note: Our company does not endorse and is not responsible for the accuracy of the contents/information contained within the linked site(s) accessible from this page.
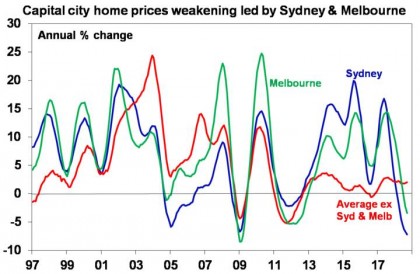
Australian capital city home prices have fallen for 12 months in a row and are down 4% from their peak. Most of the weakness relates to the previous boom time cities of Sydney and Melbourne but prices are continuing to fall in Perth and Darwin.


Source: CoreLogic, AMP Capital

This begs the questions: how far will prices drop? and what will it mean for the broader economy?

High prices and high debt – how did it come to this?

The big picture view on Australian property is:

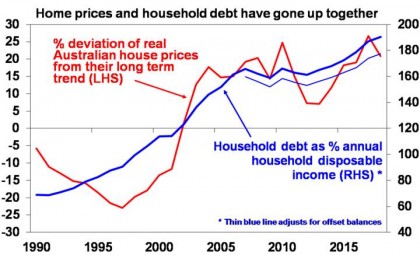
  • Real house prices started to surge in the mid-1990s. This has led to them being expensive relative to income, rents, their long-term trend and by global standards. On our valuation measures prices are around 30% overvalued. The boom since the mid-1990s has rolled through different cities at different times, eg, starting in Sydney & Melbourne, then Perth, then Sydney & Melbourne again more recently.

  • As a result, affordability is poor and while interest rates may be low it’s become hard to save for a sufficient deposit.

  • The surge in home prices has gone hand in hand with a surge in household debt. See the next chart. This has taken the household debt to income ratio from the low end of OECD countries to the top end. The shift to overvaluation and high debt mostly occurred over the 1995-2005 period.


Source: OECD, RBA, AMP Capital

It’s popular to blame negative gearing, the capital gains tax discount and foreign buying for high home prices and debt. However, the basic drivers are a combination of the shift from high to low interest rates over the last 20-30 years boosting borrowing power, along with a surge in population growth from mid-last decade and the inadequacy of a supply response (thanks to tight development controls and lagging infrastructure) to suppress the resultant rise in the ratio of prices to incomes. Since 2006, annual population growth has averaged about 150,000 above what it was over the decade to the mid-2000s, which required roughly an extra 50,000 new homes per year, but dwelling completions have only recently caught up.

The tide has turned – expect more price falls

However, starting about a year ago it seems the tide has turned against property prices reflecting a range of factors:

  • Poor affordability – which has reduced the pool of buyers.

  • A tightening in bank lending standards under pressure from regulators – particularly around tougher income and expense verification and total debt to income limits for borrowers. The latter will particularly impact cities like Sydney and Melbourne which have high price to income ratios necessitating high debt to income ratios. It will also impact property investors with multiple properties (with around 1.5 million properties held by investors with multiple properties) with banks cracking down on lending to such investors. This is all making it harder to get housing loans.

  • A significant pool of interest only borrowers are scheduled to switch to principal and interest over the next few years resulting in a sharp rise in total debt servicing costs.

  • Banks withdrawing from lending to Self-Managed Super Funds – reducing the pool of property investors.

  • A cutback in foreign demand, partly due to Australian authorities making it more difficult. Chinese investment into Australian real estate has fallen by roughly 70% since 2015.

  • Rising unit supply – as the ongoing surge in unit construction completes and hits the market with Sydney and Melbourne most at risk. This risk is highlighted by Australia’s residential crane count of 528 cranes being way above the total crane count (ie residential and non-residential) in the US of 300 and Canada of 123! 

  • Out of cycle bank mortgage rate increases may also be playing a role – although a minor one as the moves have been small, mortgage rates remain near record lows and some banks have cut rates for new borrowers.

  • Falling price growth expectations in response to falling prices risks resulting in a negative feedback loop for prices – as the FOMO (fear of missing out) phenomenon of up until a year ago risks turning into FONGO (fear of not getting out), particularly for investors as they realise they are only getting very low returns from net rental yields of around 1-2%.

  • Expectations that negative gearing and capital gains tax concessions will be made less favourable if there is a change of government are likely also impacting and have the potential to become a major drag on prices.

On their own some of these are not significant, but together they risk creating a perfect storm for the property market.

Home price outlook

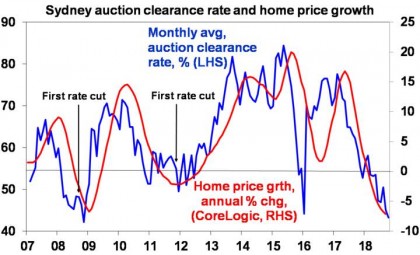
For some time, we have been expecting top to bottom falls in Sydney and Melbourne prices of 15% spread out to 2020, implying price declines around 5% per annum. However, the risks are starting to skew to the downside – particularly around tighter credit and falling capital growth expectations made worse by fears of a change in tax arrangements. Auction clearances in recent weeks have been running around levels roughly consistent with 7-8% pa price declines. See next chart.


Source: Domain, AMP Capital

As such we are now allowing for a 20% decline in prices in these cities, again spread out to 2020, which would take average prices back to first half 2015 levels.


Source: CoreLogic, AMP Capital

By contrast home prices in Perth and Darwin are either at or close to the bottom having fallen back to levels seen more than a decade ago, and prices are likely to perform a lot better in Adelaide, Brisbane, Canberra and Hobart along with regional centres as they have not seen anything like the boom in Sydney and Melbourne. But they will see some impact from tighter credit. Overall, we now expect national average prices to fall nearly 10% out to 2020 which is a downgrade from our previous expectation for a 5% national average fall.

A crash is a risk but remains unlikely

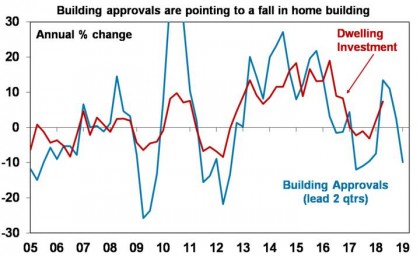
With prices now falling naturally the calls for a property crash are getting a lot of airing. But these have been wheeled out endlessly over the last 15 years or so. Our assessment remains that a crash (say a 20% or more fall in national average prices) is unlikely unless we see much higher interest rates or unemployment (neither of which are expected) or a continuation of recent high construction for several years (which is unlikely as approvals are falling) and a collapse in immigration.

Strong population growth is continuing to drive strong underlying demand for housing. While mortgage stress is a risk, it tends to be overstated: there has been a sharp reduction in interest only loans already; debt servicing payments as a share of income have actually fallen slightly over the last decade; a significant number of households are ahead on their repayments; and banks’ non-performing loans remain low. Finally, while Sydney and Melbourne are at risk other cities have not seen the same boom and so are less vulnerable.

However, the risk of a crash cannot be ignored given the danger that banks may overreact and become too tight and that investors decide to exit in the face of falling returns, low yields and possible changes to negative gearing and capital gains tax.

The property cycle and the economy

The downturn in the housing cycle will affect the broader economy via slowing dwelling construction, negative wealth effects on consumer spending, less demand for household goods and via the banks as credit growth slows and if mortgage defaults rise. This will provide an offset to strong growth in infrastructure spending and solid growth in business investment and will constrain economic growth to around 2.5-3% which in turn will keep wages growth and inflation low. All of which is consistent with our view that the RBA won’t be raising rates until 2020 at the earliest and given the downside risks related to house prices it may have to cut rates. Housing weakness will also continue to constrain bank share returns.


Source: ABS, AMP Capital

Implications for investors

Over the very long-term, residential property adjusted for costs has similar returns to Australian shares. So, there is a role for it in investors’ portfolios. However, now remains a time for caution regarding housing as an investment destination – particularly in Sydney and Melbourne where it remains expensive, prices are likely to fall further & it offers very low rental yields. Best to look at other cities and regional areas that offer much better value.


Source: AMP Capital 18 October 2018

Important notes: While every care has been taken in the preparation of this article, AMP Capital Investors Limited (ABN 59 001 777 591, AFSL 232497) and AMP Capital Funds Management Limited (ABN 15 159 557 721, AFSL 426455) makes no representations or warranties as to the accuracy or completeness of any statement in it including, without limitation, any forecasts. Past performance is not a reliable indicator of future performance. This article has been prepared for the purpose of providing general information, without taking account of any particular investor’s objectives, financial situation or needs. An investor should, before making any investment decisions, consider the appropriateness of the information in this article, and seek professional advice, having regard to the investor’s objectives, financial situation and needs. This article is solely for the use of the party to whom it is provided.


https://vimeo.com/293475742

Investors might have noted some recent positives in the Australian economy. June quarter GDP growth of 3.4% was above potential and its fastest rate since 2012.

We have also seen pretty good jobs numbers, with the unemployment rate trending down and sitting at a six-year low of 5.3%.

And job ads, job vacancies and employment surveys have also been solid. (While job vacancies growth slowed to 0.6% in the three months to August, vacancies are up 16.5% for the year and remain high.) That will probably prevent a rise in the unemployment rate.

Underemployment

But investors must put those positives in context when assessing their impact on the Reserve Bank’s likely next move for interest rates.

Firstly, while an unemployment rate of 5.3% isn’t bad, Australia is still suffering from a very high level of underemployment. If you add underemployment (currently at 8.1%) to unemployment, our total labour market underutilisation is running at around 13.4%.

That is not only historically high for Australia, but it is very high compared with the US, which is running at around 7.4%. We still have a lot of slack in our labour market.

Falling house prices

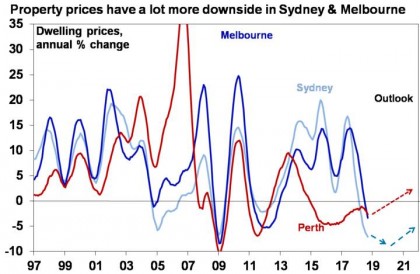
The second point to make is that the RBA has another problem: uncertain consumer spending largely due to falling house prices in Sydney and Melbourne. In September, capital city house prices, led by Sydney and Melbourne, fell again, down 0.6%. That took the year on year fall to 3.7%, the biggest since 2012.

We believe more falls in Sydney and Melbourne are likely in the next two years because of factors such as tighter lending standards and rising supply.

House prices in those cities have been falling now for a year, and that drags on consumer spending because people feel less wealthy.

The chance of a rate cut

The labour market slack and falling house prices mean I find it hard to see the RBA raising interest rates. We do have a rate hike pencilled in some time in 2020. But there will certainly be no rate rise in the next three months to the end of the year.

Indeed, there is a small risk that at some time in 2019, the RBA may have to cut interest rates again. This is not our base case. But we can’t rule out the risk that rates might have to fall a bit further if weakness in the housing sector feeds through to the broader economy and threatens inflation on the downside.

So while we believe rates are on hold for some time yet, well out to 2020, we can’t rule out another rate cut from the RBA if the falls in house prices intensify.

Soucre: AMP Capital 18 October 2018

Author: Dr Shane Oliver, Head of Investment Strategy and Economics and Chief Economist, AMP Capital

Important notes: While every care has been taken in the preparation of this article, AMP Capital Investors Limited (ABN 59 001 777 591, AFSL 232497) and AMP Capital Funds Management Limited (ABN 15 159 557 721, AFSL 426455) makes no representations or warranties as to the accuracy or completeness of any statement in it including, without limitation, any forecasts. Past performance is not a reliable indicator of future performance. This article has been prepared for the purpose of providing general information, without taking account of any particular investor’s objectives, financial situation or needs. An investor should, before making any investment decisions, consider the appropriateness of the information in this article, and seek professional advice, having regard to the investor’s objectives, financial situation and needs. This article is solely for the use of the party to whom it is provided.

Global listed infrastructure has become increasingly popular with investors who are looking to improve the resilience and diversification of their equity portfolio. This article examines investment case for infrastructure and also listed infrastructure specifically.

Firstly, let’s take a step back and look at why more and more investors are looking at allocating to infrastructure in general:

Stability

Infrastructure assets provide essential services to society, such utilities, oil and gas pipeline networks, communications and transportation infrastructure. These assets can offer stable and predictable cash flow supported by long term contracts or regulation, with monopolistic characteristics and high barriers to entry.

Yield

Global listed infrastructure also has offered an attractive income component as part of the overall total return historically. The asset class had traditionally offered higher yields than global equities. The current dividend yield spread is at 1.57% compared to the historical median of 1.40% [1]

Growth

The need for infrastructure investment is a never-ending cycle. Investment in infrastructure helps stimulate sustainable long-term economic growth. That growth then creates a need for further infrastructure. McKinsey forecasts that US$57 trillion investment is required in core infrastructure alone between 2012 and 2030 [2]. Heavily indebted governments can’t afford to spend that money themselves. Listed infrastructure companies must be part of the solution to fund this shortfall and are well positioned to benefit from attractive investment opportunities.

Now let’s focus on why the number of investors allocating to listed infrastructure has increased significantly over recent years. Global listed infrastructure is a relatively young asset class, but there is a growing recognition that the asset class delivers significant benefits to portfolios, such as:

Diversification

Investors can access a broad set of liquid investment opportunities across geographies and sectors that may not be available through direct investment. Regulatory frameworks and contracts’ structures vary greatly from sector to sector and from region to region, as they are based on and exposed to macro variables in different ways. Diversification can help mitigate risk in concentrated exposure to regional economic downturns and regulations.
Liquidity

Listed infrastructure companies offer liquid access to illiquid assets. According to Preqin, the dry powder from unlisted infrastructure funds is now at a record high at US$176 billion[3]. In contrast, the liquidity of listed infrastructure enables new allocations to be deployed with a high degree of efficiency
Valuation dislocation

In many instances, assets are co-owned by listed infrastructure companies and direct investors, and as a result, both should deliver similar returns in the long term.

Although listed and unlisted infrastructure assets with the same economic exposures will respond similarly to changes in the economic environment, valuation leads and lags do arise between both unlisted and listed infrastructure, and the volatility in daily pricing can create opportunities for an active listed infrastructure manager.

Recent macro and geopolitical events have caused an increase in volatility within the asset class. However, we believe that this has led to significant dislocations between fundamental value and prices which offers attractive medium and long-term investment opportunities.  

The outlook for global listed infrastructure remains very positive, supported by robust economic activity and stable funding markets. We continue to see the potential for future outperformance as investors seek quality defensive assets that provide sustainable yield profiles in the current low interest rate environment.

[1] Past performance is not a reliable indicator of future performance. Source: AMP Capital, Bloomberg. Period: 31 January 2003 – 30 June 2018. Global Listed Infrastructure is represented by the Dow Jones Brookfield Global Infrastructure Index and Global Equities is represented by MSCI World AC Index.

[2] McKinsey Global Institute, 2013. Infrastructure Productivity: How to save $1 trillion a year. www.mckinsey.com/insights/engineering_construction/infrastructure_productivity

[3] Preqin online database. Data as at August 2018

Source: AMP Capital 18 October 2018

Author: Giuseppe Corona, Head of Global Listed Infrastructure

Important notes: While every care has been taken in the preparation of this article, AMP Capital Investors Limited (ABN 59 001 777 591, AFSL 232497) and AMP Capital Funds Management Limited (ABN 15 159 557 721, AFSL 426455) makes no representations or warranties as to the accuracy or completeness of any statement in it including, without limitation, any forecasts. Past performance is not a reliable indicator of future performance. This article has been prepared for the purpose of providing general information, without taking account of any particular investor’s objectives, financial situation or needs. An investor should, before making any investment decisions, consider the appropriateness of the information in this article, and seek professional advice, having regard to the investor’s objectives, financial situation and needs. This article is solely for the use of the party to whom it is provided.

The long-term rise in Australian home prices has led to a huge inter-generational transfer of wealth from the young to the old. A material reversal in property values will go some way to unwinding this, creating winners and losers amongst the generations.

Australia has long had a love affair with home ownership, which is illustrated by the strong growth in residential prices over the past two decades. Prices accelerated particularly strongly over the five years to 2017 amid a strong domestic economy, low mortgage rates, tax-breaks for domestic investors and sustained interest from overseas buyers, especially from China.

These factors were supported by ongoing immigration, a widespread cultural desire in Australia to own property and a highly limited supply of new land available in the capital cities in which most Australians live and work. A flood of virtual reality tv shows based on home ownership and renovations struck a chord with aspirational Australians. A political consensus in favour of measures supportive of property owners came to be established.

This included borrowers being able to take advantage of historically low interest rates to purchase more expensive homes.

However, 2017 saw the peak in prices as lenders came under regulatory pressure to constrain lending multiples, review prospective borrowers’ spending commitments more closely and limit interest-only loans.

Furthermore, rising global interest rates have pushed up Australian mortgage rates despite domestic interest rates remaining at their historic low of 1.5%.

The withdrawal of investment buyers from the market has been followed by a more hesitant mood amongst owner-occupiers, who are either unable or unwilling to borrow the funds and provide the deposits necessary to maintain the housing market’s momentum.

Australians are likely to find themselves in very different situations depending on their home ownership history. They may be grouped into three distinct demographic cohorts, many of whose members share some broad characteristics.

Millennials

Most Australians under the age of 35 have struggled to gain a foothold on the housing ladder. By the time they had found settled jobs and saved deposits, they found that house prices had risen beyond their reach.

Sometimes characterised as the ‘smashed-avocado generation’, this group has tended to prioritise experiential spending over property acquisition. This may be partly due to a cultural shift in society, but undoubtedly at least partly reflects the low possibility of purchasing even a very modest home within reasonable proximity to work.

Property purchases have tended to be restricted to those either on the highest incomes and/or those who have enjoyed the good fortune of parents or grandparents willing and able to help fund ever increasing deposit and stamp duty payments.

There are signs that some millennials on more typical income levels have simply given up on the Aussie dream of home ownership – at least until they become beneficiaries of a future inheritance.

Families

Australians in the 35-55 age group are much more likely to be property owners. However, the 20-year upward trend in home prices has left this generation suffering varying degrees of financial stress. This has been caused by the need to take on oversized mortgages to buy their first home, typically some years after their parents would have taken the plunge into the housing market.

They are now faced with increasing mortgage rates just at the time that living costs, such as utility bills, insurance and school fees are also rising.

Accordingly, this group faces the biggest challenge as they manage their spending in the face of rising demands on their lean layer of discretionary spending.

Baby boomers

This group comprises the retired and soon-to-retire, who in Australia have been the principle beneficiaries of the long-term boom in house prices, built on low interest rates and tax benefits, such as negative gearing.

Having entered the market at much lower price levels relative to incomes, members of this group are now largely mortgage-free and sit on valuable capital gains that some have realised as they retire, re-locate and downsize.

Some members of this demographic have used gains from the property boom to help their off-spring gather the deposits necessary to get onto the housing ladder. This trend is often described as the ‘Bank of Mum and Dad’, with some analysts referring to it as the fifth biggest bank in Australia.

The boom has led to a massive intergenerational transfer of wealth from the young to old as prolonged low interest rates led to massive asset inflation, which especially affected residential housing in Australia.

However, any decline in home prices will affect these three groups in significantly different ways.

Millennials

The cohort that remains largely outside the housing market is likely to have the most to gain and least to lose from a period of falling home prices in Australia.

A significant fall in home values is not the base case of most analysts, however the more extended the correction, the more millennials will find themselves coming into reach of home ownership. Therefore, this group is viewing any extended downward trend in prices relatively positively.

Such a market correction could focus on the sale of investment properties, which could reduce the supply of rental properties and put upwards pressure on rental levels. This would be a negative for millennials not able to take advantage of falling values to buy a first home, at least in the earlier stages of a slump.

A relatively small number of this group have managed to enter the market by taking on excessively large mortgages or have bought in secondary locations where selling could become challenging. Such buyers could well face financial stress, however, these are likely to be a minority of this group.

Families

These are the people who are most exposed to a slide in home prices in Australia. This group includes the most recent entrants to the property market and thus are likely to have bought at higher price levels with larger mortgages. Unlike those who are long established in the market, many in this group will not have benefitted from much of the rise in values and thus enjoy less protection from price falls.

They are already facing the financial stress described earlier and hence are much more careful with their spending, focusing on essentials and taking advantage of cost savings found online or in discount bricks and mortar stores. This is illustrated by the high numbers of baby and kids-focussed stores closing in Australia over the last few years.

This group stands to be further impacted if a significant fall in house prices leads to them receiving lower inheritances or post-downsizing gifts from their parents.

Baby boomers

This demographic is generally mortgage-free and unlikely to move home other than to downsize to a more suitable retirement property. Thus, they are unlikely to suffer the same stress faced by families.

Their ability to make lifetime gifts and leave bequests could well be affected though, however the real impact of this will be felt by younger demographics.

Baby boomers have been the principle beneficiaries of the buy-to-let boom, and hence some members who are heavily invested in residential property will be impacted by price falls. However, even these will be affected more in terms of their ability to make gifts from reduced capital, rather than falls in the achievable rental values that provide their income.

The housing market has appeared to be a one-way bet for a long time, and the wealth level of most Australians depends largely on the point in time at which they were able to enter the market.

Younger Australians stand to gain the most from lower housing prices but will inherit less. Families will likely experience increasing financial stress from this trend, especially the more recent home purchasers or those with less certain incomes in the face of rising living costs. Most older Australians will be less affected on a day-to-day basis but the ‘Bank of Mum and Dad’ may turn out to be less liquid than had been hoped by some anticipating sizeable withdrawals.

Source: AMP Capital October 2018

Important notes: While every care has been taken in the preparation of this article, AMP Capital Investors Limited (ABN 59 001 777 591, AFSL 232497) and AMP Capital Funds Management Limited (ABN 15 159 557 721, AFSL 426455) makes no representations or warranties as to the accuracy or completeness of any statement in it including, without limitation, any forecasts. Past performance is not a reliable indicator of future performance. This article has been prepared for the purpose of providing general information, without taking account of any particular investor’s objectives, financial situation or needs. An investor should, before making any investment decisions, consider the appropriateness of the information in this article, and seek professional advice, having regard to the investor’s objectives, financial situation and needs. This article is solely for the use of the party to whom it is provided.

By Health Ambition contributor, Helen Sanders

At a Glance

  • One study showed that workday exercise, not only improves well-being but participants noted a 72 percent improvement in time management and workload completed on days when they exercised.

  • Low-intensity aerobic exercise is more effective than high-intensity exercise for improving productivity.

  • ‘Sit less, move more’ workplace studies show that employees improved productivity loss and lost workday productivity.


We all want to be more productive, flying through that to do list with a breeze, increasing our creativity and effortlessly multitasking. We try apps, push ourselves harder and longer to hit deadlines to gain that competitive edge.

Nothing seems to work, you feel you’ve reached peak performance and that pushy boss leaves you feeling exhausted, heading for a burnout.

Is there a simpler way? What’s missing from your productivity routine? Could exercise be the answer? Studies have shown exercise to increase productivity. Does it matter when you work out and is the type of exercise important? How lengthy a workout is required to see an improvement in productivity? We have the answers, so read on…

Ways That Exercise Increases Your Productivity

We all know exercise keeps you healthy but exercising can also increase productivity in all areas of your life. Not only does exercise give you more energy and stop that afternoon fatigue slump, exercise keeps momentum and it improves mental capacity. In theory, exercise helps with ‘brain fog’.

Exercise is shown to reduce stress, combat fatigue, improve performance and lead to fewer workday absences. A natural stress reducer, exercise combats chronic stress often suffered by workers. With exercise your sleep quality also improves, thus, you wake rested and ready to tackle another day.

Moreover, exercise increases your energy capacity, every time you exercise and push your limits, your body recovers and your energy capacity is increased.

Exercise ensures proper brain function in the hippocampus region. Not only does exercise keep blood, glucose and oxygen levels high, feeding the brain, it releases endorphins into the body giving your mood a boost. Aerobic exercise is shown to change the size of the area of the brain involved in memory and learning.

Exercise and Work Performance

Busy working professionals find it hard to fit exercise into their hectic schedules, but taking time for exercise actually increases mental acuity. Exercise truly feeds the brain, essential if you’re going to be more effective and efficient. When your brain is performing at full capacity, you focus better, concentrate more, and thus make smarter decisions.

More and more companies are allowing employees to take exercise at work. Big giants like Google led the way with in-office gyms and Nike have in-office yoga classes for their employees. Companies are noticing the benefits exercise has on employee productivity.

Studies of office workers who regularly exercise found that long sitting time at work was linked to a lower work productivity and decreased mental well-being. Employers have taken to implementing ‘sit less, move more’ interventions such as standing desks and offering employees time for exercise during working hours to improve work productivity.

Intelligent physical exercise training (IPET) at work was studied in Denmark with a range of occupations including dentists, office and computer workers and healthcare workers. The results showed in all jobs participants improved cardiorespiratory health and muscle strength, these health improvements, in turn, saw increased productivity and fewer lost work days through illness.

Your boss might not offer this holistic approach, or if you want to do more exercise out of work hours, knowing which exercises are best for increasing work production is key.

What’s the Best Exercise for Productivity?

Now we look at which type of exercise is scientifically proven to increase productivity and creativity.

1. Walking

Yes, simply walking as exercise gets those creative juices flowing. In fact, one study shows that when walking and after creativity was increased, with some participants up to 81 percent.

Another study showed that a lunchtime walk for 30 minutes helps battle that afternoon slump and the need to reach for the caffeine pick me up. Participants felt less stressed, less fatigued and were more alert, enabling them to easily cope with the workload.

Walking to work or a lunchtime stroll is a cheap form of exercise that raises your heart rate and is easy to fit into your schedule. Indoors on a treadmill or outdoors walking are both beneficial to increasing your productivity.

2. Yoga

Yoga’s principle teachings help to improve production. Studies have shown the positive effects of practicing yoga on self-esteem and motivation, in turn, increases a person’s ability to cope with stress load. Increased creativity, ability to problem-solve and higher energy levels were seen by participants.

3. Low-Intensity Aerobic Exercise

Low-intensity aerobic exercise is better than intense aerobic exercise. Studies show that individuals’ symptoms of fatigue are higher when intense exercise is performed and are lower with low-intensity exercise workouts.

High-intensity workouts are great for losing weight, but for a workout geared towards productivity low to moderate exercise is key.

4. Strength Training Exercises

Resistance training exercises using weights is a popular exercise workout in the gym. Studies show that mixing aerobic exercise and resistance training exercise increases brain function.

Best Conditions for Achieving Amazing Productivity

It’s recommended to exercise for 30 minutes on five days of the week for a healthy lifestyle. The minimum amount of exercise recommended by the American College of Sports Medicineper exercise session is at least 10 minutes.

When exercising to increase productivity, progress and consistency is more important than anything. You’re exercising to increase mood and energy not strength, so short bursts of exercise are easier to stick to in your daily routine, doing just enough exercise to mentally refresh.

Choose an exercise you like, you’re more likely to keep up something you enjoy rather than seeing your exercise workout as another chore.

The timing of your exercise sessions is important too, with an already busy work schedule most of us find it hard balancing work and family commitments. Working out at the end of the day isn’t going to benefit an already tired body. It’s recommended to exercise in the morning or at lunchtime to enhance your brain power and productivity.

Taking time to exercise before a meeting will keep you mentally sharp. A power walk at lunchtime can combat that mental fog and afternoon slump that makes you reach for the caffeine or energy drink pick me up.

The Bottom Line

Exercise is recommended for a healthy lifestyle and the benefits of exercise improve attention span, accuracy, memory and how fast our brains process information. All these benefits of exercise enable you to make decisions quickly and thus increases your productivity.

Just doing a short exercise workout gives results and you don’t have to break a sweat to get your brain on top form. Increased productivity is noticeable within weeks of implementing an exercise regime.

Exercise raises your energy levels, combats stress, battles fatigue and improves general well-being. When you feel happier and energized you’re more efficient and effective at all tasks in life.

The bottom line is that exercise is more than medicine!


Source : Health Ambition September 2018

Reproduced with the permission of www.healthambition.com


Important:
Any information provided by the author detailed above is separate and external to our business and our Licensee. Neither our business, nor our Licensee take any responsibility for any action or any service provided by the author.

Any links have been provided with permission for information purposes only and will take you to external websites, which are not connected to our company in any way. Note: Our company does not endorse and is not responsible for the accuracy of the contents/information contained within the linked site(s) accessible from this page.
 

Critical challenges for super fund members in the accumulation phase are to keep their savings intact and to keep adding to those savings when possible with voluntary contributions.

Australia’s $2.6 trillion-plus super savings can present a powerful temptation to obtain some of that money early.

There are basically two instigators of attempts to prematurely access super. There are the members themselves and then there are the operators of illegal early-access schemes claiming to show members how to get around the law.

The most fundamental superannuation rule is that super savings are there to provide retirement benefits – not to subsidise preretirement lifestyles, or to pay pressing personal expenses (with certain exceptions) before retirement.

Generally, super fund members cannot gain access their super benefits before turning 65 or reaching their “preservation age” (at least 55) and retiring.

Members can seek to legally gain early access to their super early on various compassionate grounds, severe financial hardship, terminal illness or incapacity.

Other ways that fund members can legally access early their super are through the new first home super saver scheme and transition-to-retirement pensions. Members taking a transition-to-retirement pension can receive up to 10 per cent a year of the balance in their super pension accounts as a pension upon reaching their preservation age yet before retiring.

Early access schemes

In recent weeks, the tax office has issued renewed warnings about illegal early-access schemes – persistent scams that have blighted superannuation for years – and about the responsibilities of self-managed super fund (SMSF) trustees not to release super prematurely.

A favoured approach of the early-access schemes is to persuade members of large super funds to rollover their super into a new SMSF before taking the savings out of the super system.

Scheme promoters try to convince fund members to access their super money to pay such expenses as a new car, holiday and financial help to their families. In the past, the tax office has warned against using super money to try to prop up small businesses experiencing financial difficulties.

Consequences for SMSF trustees

SMSF trustees should be aware of the possible consequences of allowing early access to super. These include disqualification as trustees, their fund being made non-compliant (with the costly loss of concessional tax treatment), penalties payable by the trustees and prosecution.

Against members’ interests

Perhaps the bottom line is that members who prematurely access their super savings are hurting themselves. They are potentially eroding their standards of living in retirement.

Please contact us on Phone: 07 5641 4134 if you seek further assistance .

 Source : Vanguard August 2018

Written by Robin Bowerman, Head of Corporate Affairs at Vanguard.

Reproduced with permission of Vanguard Investments Australia Ltd

Vanguard Investments Australia Ltd (ABN 72 072 881 086 / AFS Licence 227263) is the product issuer. We have not taken yours and your clients’ circumstances into account when preparing this material so it may not be applicable to the particular situation you are considering. You should consider your circumstances and our Product Disclosure Statement (PDS) or Prospectus before making any investment decision. You can access our PDS or Prospectus online or by calling us. This material was prepared in good faith and we accept no liability for any errors or omissions. Past performance is not an indication of future performance.

© 2018 Vanguard Investments Australia Ltd. All rights reserved.

Important:
Any information provided by the author detailed above is separate and external to our business and our Licensee. Neither our business, nor our Licensee take any responsibility for any action or any service provided by the author.

Any links have been provided with permission for information purposes only and will take you to external websites, which are not connected to our company in any way. Note: Our company does not endorse and is not responsible for the accuracy of the contents/information contained within the linked site(s) accessible from this page.
Introduction

Every so often shares go through rough patches. We saw this most recently around February on the back of US inflation and interest rate concerns and the start of US tariffs which saw US shares and global shares fall roughly 10% and Australian shares fall 6%. Shares mostly recovered – even getting through the seasonally weak months of August and September surprisingly well – with US shares making new records and Australian shares hitting a ten-year high, but the worry list has returned again with US, global shares and Australian shares now down around 7% from their recent high. This note looks at the issues for investors and puts the falls into context.

What’s driving the latest plunge?

The recent plunge reflects a range of factors.

  • Investors have started to worry again that the very strong US economy will push the Fed into tightening a lot more and that this will cause a further sharp rise in bond yields which will threaten growth and share market valuations.

  • The trade conflict between the US and China is continuing to intensify and spilling over into other areas.

  • Technology shares, which have been key drivers of the US share markets rally (and outperformance) have been vulnerable – being somewhat overvalued and facing increased regulation in the US (which is something that President Trump has been threatening).

  • Rising oil prices due to strong global demand and threats to supply have added to concerns about inflation and growth.

  • Problems in the emerging world partly due to rising US interest rates poses a threat to global growth as reflected in a recent downgrade to the IMF’s global growth forecasts.

  • Nervousness remains in the US around President Trump and the Mueller inquiry and the upcoming US mid-term Congressional elections.

  • Tensions in the Eurozone regarding the Italian budget are weighing on European shares.

  • October is also known for share market volatility and this October is the 31st anniversary of the 1987 crash which often seems to create a bit of apprehension.

Because shares have fallen rapidly they are technically oversold and so could have a short-term bounce. But given that many of these issues could get worse before they get better the risk is that the pullback has further to go.

Considerations for investors

Sharp market falls with headlines screaming that billions of dollars have been wiped off the share market (funny that you never see the same headlines on the way up!) are stressful for investors as no one likes to see the value of their investments decline. However, several things are worth bearing in mind:
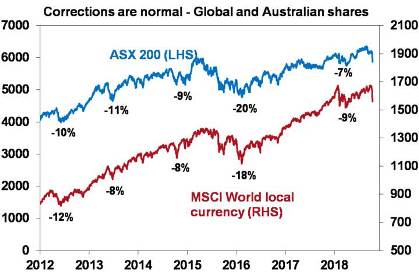
First, periodic corrections in share markets of the order of 5-15% are healthy and normal. For example, during the tech/dot. com boom from 1995 to early 2000, the US share market had seven pull backs greater than 5% ranging from 6% up to 19% with an average decline of 10%. During the same period, the Australian share market had eight pullbacks ranging from 5% to 16% with an average fall of 8%. All against a backdrop of strong returns every year. During the 2003 to 2007 bull market, the Australian share market had five 5% plus corrections ranging from 7% to 12%, again with strong positive returns every year. More recently, the Australian share market had a 10% pullback in 2012, an 11% fall in 2013 (the taper tantrum), an 8% fall in 2014, a 20% fall between April 2015 and February 2016 and a 7% fall earlier this year all in the context of a gradual rising trend. And it has been similar for global shares, but against a strongly rising trend. See the next chart. While they can be painful, share market corrections are healthy because they help limit a build-up in complacency and excessive risk taking.

Source: Bloomberg, AMP Capital

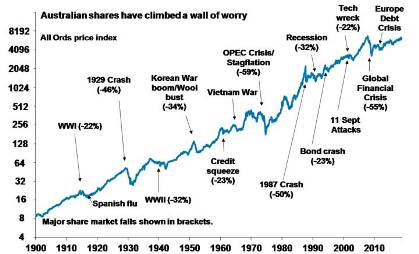
Related to this, shares climb a wall of worry over many years with numerous events dragging them down periodically, but with the long-term trend ultimately up & providing higher returns than other more stable assets. Bouts of volatility are the price we pay for the higher longer-term returns from shares.

Source: ASX, AMP Capital

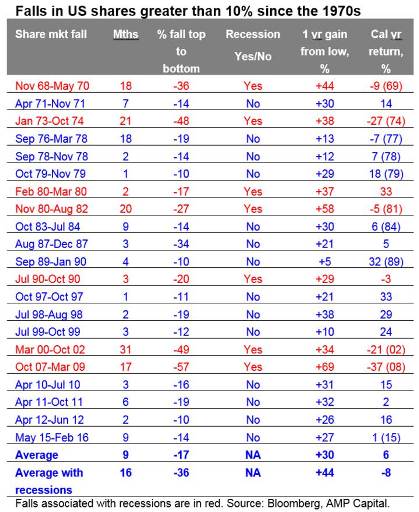
Second, the main driver of whether we see a correction (a fall 5% to 15%) or even a mild bear market (with say a 20% decline that turns around relatively quickly like we saw in 2015-2016) as opposed to a major bear market (like that seen in the global financial crisis (GFC)) is whether we see a recession or not – notably in the US. The next table shows US share market falls greater than 10% since the 1970s. I know it’s a bit heavy – but I like this table! The first column shows the period of the fall, the second shows the decline in months, the third shows the percentage decline from top to bottom, the fourth shows whether the decline was associated with a recession or not, the fifth shows the gains in the share market one year after the low and the final column shows the decline in the calendar year associated with the share market fall. Falls associated with recessions are highlighted in red. Averages are shown for the whole period and for falls associated with recession at the bottom of the table.

Several points stand out. First, share market falls associated with recession tend to be longer and deeper. Second, falls associated with recessions are more likely to be associated with negative total returns (ie capital growth plus dividends) in the associated calendar year as a whole. Finally, as would be expected the share market rebound in the year after the low is much greater following falls associated with recession.

So whether a recession is imminent or not in the US is critically important in terms of whether we will see a major bear market or not. In fact, the same applies to Australian shares. Our assessment remains that US/global recession is not imminent:

  • Still high levels of business and consumer confidence globally are only just starting to help drive stronger consumer spending and business investment.

  • While US monetary conditions have tightened they are far from tight and they are still very easy globally and in Australia (with monetary tightening still a fair way off in Europe, Japan and Australia). We are a long way from the sort of monetary tightening that leads into recession.

  • Fiscal stimulus will boost US growth into next year, partly offsetting Fed rate hikes.

  • We have not seen the excesses – in terms of debt growth, overinvestment, capacity constraints and inflation – that normally precede recessions in the US, globally or Australia.

Reflecting this, global earnings growth is likely to remain reasonable providing underlying support for shares. So, for all these reasons its likely that the current pull back is more likely to be a correction rather than a major bear market.

Third, selling shares or switching to a more conservative investment strategy or superannuation option after a major fall just locks in a loss. With all the talk of billions being wiped off the share market, it may be tempting to sell. But this just turns a paper loss into a real loss with no hope of recovering.

Fourth, when shares and growth assets fall they are cheaper and offer higher long-term return prospects. So, the key is to look for opportunities the pullback provides. It’s impossible to time the bottom but one way to do it is to average in over time.

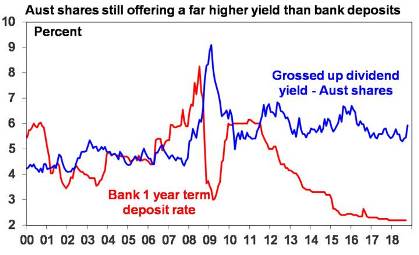
Fifth, while shares may have fallen, dividends from the market haven’t. So the income flow you are receiving from a well-diversified portfolio of shares remains attractive, particularly against bank deposits.

Source: RBA, Bloomberg, AMP Capital

Sixth, shares and other related assets often bottom at the point of maximum bearishness, ie just when you and everyone else feel most negative towards them. So the trick is to buck the crowd. “Be fearful when others are greedy. Be greedy when others are fearful,” as Warren Buffett has said.

Finally, turn down the noise. At times like this, negative news reaches fever pitch. Talk of billions wiped off share markets and warnings of disaster help sell copy and generate clicks and views. But such headlines are often just a distortion. We are never told of the billions that market rebounds and the rising long-term trend in share prices adds to the share market. Moreover, they provide no perspective and only add to the sense of panic. All of this makes it harder to stick to an appropriate long-term strategy let alone see the opportunities that are thrown up. So best to turn down the noise and chill out – yeah, I agree it’s sometimes easier said than done, but still!

Source: AMP Capital 12th October 2018

Important notes: While every care has been taken in the preparation of this article, AMP Capital Investors Limited (ABN 59 001 777 591, AFSL 232497) and AMP Capital Funds Management Limited (ABN 15 159 557 721, AFSL 426455) makes no representations or warranties as to the accuracy or completeness of any statement in it including, without limitation, any forecasts. Past performance is not a reliable indicator of future performance. This article has been prepared for the purpose of providing general information, without taking account of any particular investor’s objectives, financial situation or needs. An investor should, before making any investment decisions, consider the appropriateness of the information in this article, and seek professional advice, having regard to the investor’s objectives, financial situation and needs. This article is solely for the use of the party to whom it is provided.

By Flying Solo contributor, By Kelly Exeter

So you’re completely flat out yet have cash flow problems and never seem to have money in the bank. Where are you going wrong? Kelly Exeter has a few ideas (from experience).

Seven years ago my graphic and web design business was growing at a mad rate. My three staff and I were all ‘head down, bum up’ from the time we entered the office right up to when we left each day and I was also working stupidly long hours on weekends to keep up.

Yet we never seemed to have any money in the bank. Cash flow problems were ever-present and I spent a huge amount of time stressing about whether I’d be able to pay bills and wages each week.

Where were we going wrong? These three main places:

“Like many people in service-based businesses, I was charging an hourly rate and the client only paid for the time we spent actually working on a job. “

1. An unviable business model

Like many people in service-based businesses, we were charging an hourly rate and the client only paid for the time we spent actually working on a job. Not for the time spent:

  • Quoting and providing different options.

  • Answering questions (which is effectively consulting).

  • Going back and forth on email about proofs and changes.

Not only that …

You’ve probably heard this story about Picasso. While sketching on the street one day a woman recognised him and begged him to do her portrait. He completed it quickly, she asked how much and he said $5,000. “But it only took you five minutes!” she exclaimed, to which he replied “Madame, it took my entire life.”

Unlike Picasso, as we got more efficient at actually doing the work, we charged less. Sometimes a client would get a logo design from us for $200 because we managed to nail it in a couple of hours. Yet the only reason we were able to nail that logo design in such a small amount of time was because of our extensive briefing process (refined over several years) and our abilities as designers (also refined over several years). If we had poorer processes and took longer to come up with our designs, we could have charged more. Crazy!

How we fixed it: We changed our logo (and website) design pricing away from a ‘by-the-hour’ structure to a flat rate structure –  we started charging for value rather than hours. The flat rate covered the time we knew we’d spend going back and forth with a client regarding their requirements, the expertise we brought to the table (ie the ability to know which questions to even ask) and finally, the time we took, on average, to deliver a quality design.

2. No recurring income

In the very early days of the business I had several clients on retainer. They paid a flat rate every month and this covered all their design requirements. For the most part, it was a great arrangement for both them, and us. In some months, however, the workload from our retainer clients was so high it left little time to do work for ‘pay-as-you-go’ clients. So in the end, we moved everyone to the pay-as-you-go arrangement.

Big mistake.

Yes, having retainer style relationships with clients can mean that in certain months your workload explodes, but knowing there is a guaranteed sum of money coming into your bank account each month is worth the odd stressful month here and there.

How to fix it: Retainer style arrangements aren’t the only way to have recurring income. You can also run an evergreen online course, have monthly live events, write a book, create a membership site or develop some software-as-a-service (saas). No matter which way you decide to go, having recurring income coming into your business is essential for ensuring there is always money in the bank.

3. Bad invoicing systems

Boy oh boy – did I use to have some poor invoicing practices!

First of all, if something took me less than 15 minutes, I never charged for it. To me, it was a nice thing to do for my clients. Unfortunately, I quickly found myself spending whole days doing sub-15 minute jobs for a bunch of different people … and charging for none of that time.

Secondly I used to invoice once a month, at the end of the month. This meant if a job finished on 1 May, it wouldn’t be invoiced until 30 May. That’s 29 days without payment.

Thirdly we used to have 30 day payment terms. See that job that finished on 1 May? The client had until 30 June to pay it. So now it could be up to 60 odd days before receiving payment for that particular job. And that’s if the client paid on time. If they didn’t, it could get out to 90 days before we received payment because I didn’t have time to chase up unpaid invoices until the end of each month.

How to fix it: I go into more detail here but the major things we did were:

  1. Created a minimum job charge for jobs that took less than one hour.

  2. Started invoicing jobs as soon as they were finished.

  3. Shortened our payment terms from 30 days to 7 days. (Can you walk out of a restaurant without paying for your meal? No? Then it’s not reasonable to hand over artwork or a printed flyer to a client and then wait 30 days for payment.)

  4. Started sending payment reminders for invoices the day they crossed into ‘overdue’.

  5. Started taking a deposit for larger jobs.

  6. Created payment terms that applied to everyone (including friends).

  7. Communicated our payment terms very clearly to new clients; and the reasons for the change in terms very clearly to existing clients.

It’s very disheartening to be working your butt off day in, day out and not see this reflected in your bank account. I hope the above has provided you with some food for thought, and also some very practical ideas you can activate quick smart to help with any cash flow problems.

For further assistance please contact us on Phone: 07 5641 4134


Source : FlyingSolo September 2018 

This article by Kelly Exeter  is reproduced with the permission of Flying Solo – Australia’s micro business community.Find out more and join over 100k others


Important:
This provides general information and hasn’t taken your circumstances into account. It’s important to consider your particular circumstances before deciding what’s right for you. Any information provided by the author detailed above is separate and external to our business and our Licensee. Any information provided by the author detailed above is separate and external to our business and our Licensee. Neither our business, nor our Licensee take any responsibility for any action or any service provided by the author.

Any links have been provided with permission for information purposes only and will take you to external websites, which are not connected to our company in any way. Note: Our company does not endorse and is not responsible for the accuracy of the contents/information contained within the linked site(s) accessible from this page.