Are you a woman who’s in control of her finances?

With many women likely to become solely responsible for their financial wellbeing at some point in their lifetime, you might very well want to be.

Higher rates of divorce coupled with women living longer than men1 brings to light an important point, if you’re a woman, and that’s the likelihood that at some stage in your lifetime you’ll be responsible for your own financial wellbeing (if you aren’t already).

If you’re thinking, (meh!) my other half will always take care of me, you might be interested to know that according to a study published by UBS Wealth Management in the United States last year, eight out of 10 women will become solely responsible for their financial wellbeing at one point or another2.

We take a look at some of the insights that came out of the report, as well as what tips women had for other women in regard to their money matters.

Findings from the report

Some of the statistics that came out of the study included the following3:

  • 59% of divorcees and widows wish they’d been more involved in long-term financial decisions.

  • 56% of divorcees and widows discovered financial surprises after the fact, such as high debt, outdated wills and hidden accounts.

  • 53% would have done fewer household chores to find more time for finances.

  • 98% encouraged other women to take a more active role in their money matters.

Cross-generational differences

According to the report, younger women were perpetuating rather than transforming the status quo, with 61% of Millennial women leaving financial decisions to their partner, compared to 55% of Generation X women and 54% of Baby Boomer women4.

Despite this, younger women were also more likely to believe they should be doing more to better manage their finances than their older counterparts5.

Meanwhile, the reasons why women minimised their role in major financial decisions, included men being seen as financial providers, men often being the bread winners within the household and time constraints providing challenges for women, as they often took on the majority of household duties, which included paying bills and tracking day-to-day spending6.

Actions you could take today

Some insights that came out of the research included7:

  • Know what assets and liabilities you have

  • Know what you want in life

  • Know what cashflow you have to meet your short-term expenses

  • Know what you’ve got behind you for your longer-term needs, like retirement

  • Know what you want beyond that, such as whether you want to leave an inheritance

  • Have the money talk with your partner

Please contact us on Phone: 07 5641 4134 if we can be of any assistance on this topic 

1-7 UBS Report – Own your worth (How women can break the cycle of abdication and take control of their wealth) pages 1, intro, 2, 3, 5, 6, 9

Source : AMP January 2019

 Important information:This information is provided by AMP Life Limited. It is general information only and hasn’t taken your circumstances into account. It’s important to consider your particular circumstances and the relevant Product Disclosure Statement or Terms and Conditions, available by calling 13 30 30, before deciding what’s right for you. Read our Financial Services Guide for information about our services, including the fees and other benefits that AMP companies and their representatives may receive in relation to products and services provided to you. All information on this website is subject to change without notice. Although the information is from sources considered reliable, AMP does not guarantee that it is accurate or complete. You should not rely upon it and should seek professional advice before making any financial decision. Except where liability under any statute cannot be excluded, AMP does not accept any liability for any resulting loss or damage of the reader or any other person

Deciding on a school could be as simple as geography but sometimes other factors, like your finances, play a part in the selection process.

If you’re thinking about what school to enrol your children into, it might be a more complicated decision than merely opting for something in the local area.

Family values, student facilities, extra-curricular activities and your financial situation could all come into play. We look at some of the things to consider and what you can expect to pay.

1. Choosing a school close by

Attending a school close to home can have its advantages—your kids’ classmates will often live nearby and as a result, also be involved in the same sports or extra-curricular activities.

Time and money can also be saved on commuting when school is a short stroll, lift or bus trip away.

2. Family values and personal preferences

You may want to think about whether a school’s culture, philosophy, religious affiliations or emphasis on academia, arts or sporting achievements align with your own family ideals.

It’s also worth considering whether you have preferences around things like class sizes, assessment techniques, disciplinary policies, single-sex or co-ed environments, and teacher/parent communication.

3. Facilities, support and additional programs

Other things that may be important to you and your family might involve the amenities and services on offer, such as:

  • Library, computer room, science lab

  • Facilities for sport, music and art

  • Playgrounds and cafeterias

  • Counselling services and first aid

  • Before and after-school care 

  • Extra-curricular activities and programs

  • Language, literacy and numeracy tutoring

  • Financial support or incentives, including scholarships.

4. What you can expect to fork out

According to figures from ASG, for a child born today, the total cost of schooling in a capital city (from ages 0 to 17) is estimated to be around1:

  • $68,007 if they attend government schools

  • $252,085 if they attend systemic/catholic schools

  • $499,593 if they attend private schools.

For many families, money will play a part in the decision-making process, which is why it’s a good idea to start planning for your children’s education early on—think school fees, uniforms, travel, stationery and additional activities.

While there’s a significant variation in cost, expensive schools don’t necessarily guarantee a greater experience or better results.

5. Government subsidies

Depending on where you live, you may be eligible for financial benefits to help with things such as transport, textbooks, extra-curricular activities and other education-related expenses.

Check out our article for a bit of a rundown on what’s available in different Australian states and territories – Are you eligible for school subsidies?

6. Waiting lists and entry requirements

Some schools have waiting lists and entry requirements which may depend on academic or sporting achievements, or whether you’re located in the school’s district.

It’s worth researching these things early on because while you may think you have plenty of time to decide, realistically you may not, with some schools advising to enrol your kids immediately after birth.

7. Ways to narrow down your shortlist

If you’ve narrowed down your shortlist, but are still undecided, a bit of extra research could help. You can check out performance data online via My School, which includes recent NAPLAN results.

Numbers aren’t everything though, so look to other sources of information to gauge school attitudes and strengths, such as the school website, annual reports, open days, information nights and associated online networks.

Talking to staff, the principal, other students’ parents and the wider community could also go a long way.

Source : AMP January 2019 

 Important information:This information is provided by AMP Life Limited. It is general information only and hasn’t taken your circumstances into account. It’s important to consider your particular circumstances and the relevant Product Disclosure Statement or Terms and Conditions, available by calling 13 30 30, before deciding what’s right for you. Read our Financial Services Guide for information about our services, including the fees and other benefits that AMP companies and their representatives may receive in relation to products and services provided to you. All information on this website is subject to change without notice. Although the information is from sources considered reliable, AMP does not guarantee that it is accurate or complete. You should not rely upon it and should seek professional advice before making any financial decision. Except where liability under any statute cannot be excluded, AMP does not accept any liability for any resulting loss or damage of the reader or any other person


As Australia’s $2.8-trillion super system attracts even more headlines than usual, more people may mistakenly assume that almost everyone in the workforce is covered by at least compulsory contributions.

In reality, the position is far different.

A research paper* from the Association of Superannuation Funds of Australia (ASFA) reminds us that a “substantial proportion” of Australia’s workforce is self-employed and therefore does not receive superannuation guarantee (SG) contributions.  

In other words, they are out in the super cold – unless they are among the small minority of the self-employed who make voluntary contributions or who have built-up some super savings from past employment.

Based on Australian Bureau of Statistics data, ASFA’s paper points out that 1.267 million people or about 10 per cent of our total workforce, as at August 2017, were owner-managers of unincorporated small businesses as their main occupation.

And the percentage of the workforce that is self-employed and uncovered by compulsory super contributions is expected to rise with the seemingly-relentless growth of the gig economy.

Here’s another key statistic. Some 20 per cent of the self-employed have no super whatsoever compared to 8 per cent of employees.

Critically, any super held by the self-employed is often extremely small, arising from whenever they have been classified as employees and eligible for compulsory contributions. Often, their modest super savings arise from the time they first joined the workforce and from occasional employment.

It seems paradoxical that the self-employed are among the most enthusiastic supporters of self-managed super when the majority of the self-employed have little or no super.

What can a self-employed person take to make that they don’t miss out on super? Here are a few tips:   

  • Try to make regular contributions as if employed: Think about making contributions that are at least the equivalent of the compulsory contributions you would have received if employed. (The superannuation guarantee rate is currently 9.5 per cent of an employee’s ordinary earnings up to a maximum salary amount.)

  • Claim a tax deduction for concessional contributions: The self-employed can claim tax deductions for their concessional (before-tax) contributions. The annual concessional cap for all eligible super fund members is $25,000. (Concessional contributions comprise compulsory contributions, salary-sacrificed contributions and personally-deductible contributions by eligible self-employed individuals and investors.)

  • Contribute early, contribute often and contribute as much as you can afford:  By following this disciplined approach, you will reduce the chances of being left behind employees with your super savings.

  • Look for opportunities to contribute more: If you receive, say, an inheritance or sell a non-super investment, consider contributing some of the money to super within the contribution caps. (The standard non-concessional, after-tax, contributions cap is $100,000 for 2018-19. Fund members under 65 have the option of contributing up to $300,000 in non-concessional contributions over three years, depending upon their total super balance.)  

  • Think carefully before cutting your contributions if cash is tight: A temptation for the self-employed is to cut super contributions if business cash-flow becomes tight. Consider the long-term implications for your retirement savings of reducing your contributions; there may be other ways for your business to save money.

  • Don’t overlook the insurance side of super: Most Australians with life and permanent disability insurance obtain at least default cover through their large super funds. And many of the self-employed also choose to hold income-protection insurance through their funds.

  • Aim to obtain asset protection with super: Self-employed business owners sometimes seek advice about how their super savings may be protected in the unfortunate event of a future bankruptcy – subject to claw-back provisions in bankruptcy law.

  • Watch for a gig-economy super trap: Understand that employers are not obliged to make super guarantee contributions for employees earning less than $450 a month before tax. This means, for instance, that employees making up their incomes doing a number of part-time jobs for different employers may fall below the threshold for each.

  • Guide young family members towards super: If you have young family members working in the gig economy, perhaps in a series of part-time jobs, consider talking to them about the benefits of making voluntary super contributions.

Most of us have probably heard a self-employed business owner say “my business is my super” or similar words. Their expectation is often to eventually sell their businesses to raise enough capital to finance their retirement. But how realistic are those expectations?

As a past ASFA research paper points out that while some of these businesses may have a value of “a million dollars or more”, others may be worth may worth “little more than the market value of a second-hand utility or truck and some tools of trade”.

*Superannuation balances of the self-employed by Andrew Craston, Association of Superannuation Funds of Australia, 2018.

 Source : Vanguard February 2019 

By Robin Bowerman, Head of Corporate Affairs at Vanguard.

Reproduced with permission of Vanguard Investments Australia Ltd

Vanguard Investments Australia Ltd (ABN 72 072 881 086 / AFS Licence 227263) is the product issuer. We have not taken yours and your clients’ circumstances into account when preparing this material so it may not be applicable to the particular situation you are considering. You should consider your circumstances and our Product Disclosure Statement (PDS) or Prospectus before making any investment decision. You can access our PDS or Prospectus online or by calling us. This material was prepared in good faith and we accept no liability for any errors or omissions. Past performance is not an indication of future performance.

© 2019 Vanguard Investments Australia Ltd. All rights reserved.

Important:
Any information provided by the author detailed above is separate and external to our business and our Licensee. Neither our business, nor our Licensee take any responsibility for any action or any service provided by the author.

Any links have been provided with permission for information purposes only and will take you to external websites, which are not connected to our company in any way. Note: Our company does not endorse and is not responsible for the accuracy of the contents/information contained within the linked site(s) accessible from this page.

Investing seems to be getting more and more complex. Ever increasing complexity in terms of investment products and choices, regulations and rules around investing, the role of social media in amplifying the noise around investment markets and the increasing ways available to access various investments are all adding to this complexity. However, at its core, the basic principles of successful investing are simple. And one way to demonstrate that is in charts or pictures. This note revisits five charts I find useful in understanding investing. They are particularly pertinent in volatile and seemingly uncertain times like the present, so they are worth a revisit.

Chart #1 The power of compound interest

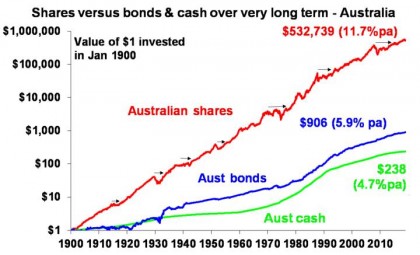
My love of this chart came out of my good friend and well-known economist, Dr Don Stammer, regularly espousing the importance of the magic of compound interest. And it is like magic – but many miss out because they are too busy looking for disasters around the corner or assuming that once disaster hits it will be with us indefinitely! What it shows is the value of $1 invested in various Australian assets in 1900 allowing for the reinvestment of dividends and interest along the way.


Source: Global Financial Data, AMP Capital

That $1 would have grown to $238 if invested in cash, to $906 if invested in bonds and to $532,739 if invested in shares. While the average return since 1900 is only double that in shares relative to bonds, the huge difference between the two at the end owes to the impact of compounding or earning returns on top of returns. So any interest or return earned in one period is added to the original investment so that it all earns a return in the next period. And so on. I only have Australian residential property data back to 1926 but out of interest it shows (on average!) similar long term compounded returns to shares.

Blowed if I know where it came from, but the “Law of 72” is useful way to understand how long it takes an investment to double in value using compounding. Just divide 72 by the rate of return and that’s the answer (roughly). For example, if the rate of return is 2% per annum (eg, the interest rate on a bank term deposit), it will take 36 years to double in value (= 72 divided by 2). But if it’s, say, 8% pa (eg, what shares may be expected to return over the medium-term including dividends), then it will take just 9 years (= 72 divided by 8).

Key message: to grow our wealth, we must have broad exposure to growth assets like shares and property. This is far more important than second order issues like which particular stocks to have in your share portfolio. While shares have been volatile lately and the short-term outlook for Australian housing is messy, both will likely do well over the long term.

Chart #2 The investment cycle lives on

The trouble is that shares can have lots of setbacks along the way as is particularly evident during the periods highlighted by the arrows on the share market line. The higher returns shares produce over time relative to cash and bonds is compensation for the periodic setbacks that they have. But understanding those periodic setbacks – that there will always be a cycle – is important in being able to not miss out on the higher returns that shares and other growth assets provide over time. The next chart shows a stylised version of the investment cycle.

The investment cycle


Source: AMP Capital

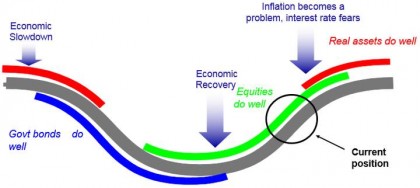
The grey line shows the economic cycle from “boom” to “bust” to “boom” again. Just before the low point in the economic cycle, shares invariably find a bottom and start to move higher thanks to attractive valuations and easy monetary policy and as smart investors anticipate an eventual economic recovery. This phase usually sees scepticism and disbelief as economic conditions are still weak. Shares are eventually supported by stronger earnings as economic conditions improve, which eventually gives way to a blow off phase or euphoria as investors pile in. This ultimately comes to an end as rising inflation flowing from strong economic growth results in ever tighter monetary policy, which combines with smart investors anticipating an economic downturn and results in shares falling. Often around the top of the cycle real assets – like property and infrastructure – are a better bet than shares as they benefit from strong real economic conditions. But that’s not always the case. Once the downturn starts, bonds are the place to be as slowing growth gives way to falling inflation which sees bond yields fall producing capital gains for investors. At some point, of course, easing monetary conditions and attractive valuations see shares bottom out and the whole cycle repeats.

Key message: cycles are a fact of life and it’s usually the case that the share market leads the economic cycle (bottoming before economic recovery is clear and topping before economic downturn hits) and that different assets do best at different phases in the cycle. Of course, each cycle is a bit different. Some are short but some, like the big bull market in US shares since 2009, are long because the recovery is slow and so it takes longer to build up excesses that end the cycle.

Chart #3 The roller coaster of investor emotion

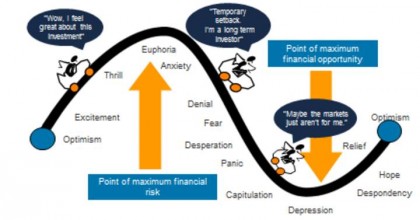
Its well known that the swings in investment markets are more than can be justified by moves in investment fundamentals alone – like profits, dividends, rents and interest rates. This is because investor emotion plays a huge part. The next chart shows the roller coaster that investor emotion traces through the course of an investment cycle. A bull market runs through optimism, excitement, thrill and ultimately euphoria by which point the asset class is over loved and overvalued and everyone who is going to buy has – and it becomes vulnerable to bad news. This is the point of maximum risk. Once the cycle turns down in a bear market, euphoria gives way to anxiety, denial, capitulation and ultimately depression at which point the asset class is under loved and undervalued and everyone who is going to sell has – and it becomes vulnerable to good (or less bad) news. This is the point of maximum opportunity. Once the cycle turns up again, depression gives way to hope and optimism before eventually seeing euphoria again.

The roller coaster of investor emotion


Source: Russell Investments, AMP Capital

Key message: investor emotion plays a huge role in exaggerating the investment cycle. The key for investors is not to get sucked into this emotional roller coaster: avoid assets where the crowd is euphoric and convinced it’s a sure thing and favour assets where the crowd is depressed and the asset is under loved. Of course, doing this is easier said than done which is why many, if not most, investors end up getting wrong footed by the investment cycle. Getting sucked in during the good times only to panic out during the bad times.

Chart #4 The wall of worry

There is always something for investors to worry about. The worries ramped up last year with concern around inflation, the Fed, rising bond yields, trade wars, US politics and President Trump generally, Italy, the ongoing Brexit soap opera, Chinese debt and slowing growth, the surging and then plunging oil price and in Australia with the Royal Commission and falling home prices. And in a world where social media is competing intensely with old media and itself for attention on the nearest screen right in front of you it all seems more magnified and worrying than ever. But of course most of this stuff is just noise. The global economy has had plenty of worries over the last century, but it got over them with Australian shares returning 11.7% per annum since 1900, with a broad rising trend in the All Ords price index as can be seen in the next chart, and US shares returning 9.8% pa. (Note that this chart shows the All Ords share price index whereas the first chart shows the value of $1 invested in the All Ords accumulation index, which allows for changes in share prices and dividends.)


Source: ASX, AMP Capital

Key message: worries are normal around the economy and investment markets but most of them are just noise. It all seems louder and more worrying now because it’s getting magnified by social media screaming for attention. Try to turn it down.

Chart #5 Time is on your side

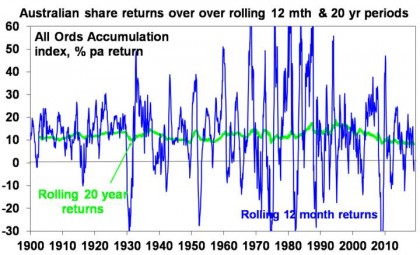
In the short term, investment markets bounce all over the place. Even annual returns in the share market are highly volatile, but longer-term returns tend to be solid and relatively smooth as can be seen in the next chart. Since 1900, for Australian shares roughly two years out of ten have had negative returns but there are no negative returns over rolling 20-year periods. (It’s roughly three years out of ten for US shares since 1900.)


Source: Global Financial Data, AMP Capital

Key message: the longer the time horizon, the greater the chance your investments will meet their goals. So in investing, time is on your side and its best to invest for the long term.


Source: AMP Capital 13 Feb 2019

Important notes: While every care has been taken in the preparation of this article, AMP Capital Investors Limited (ABN 59 001 777 591, AFSL 232497) and AMP Capital Funds Management Limited (ABN 15 159 557 721, AFSL 426455) makes no representations or warranties as to the accuracy or completeness of any statement in it including, without limitation, any forecasts. Past performance is not a reliable indicator of future performance. This article has been prepared for the purpose of providing general information, without taking account of any particular investor’s objectives, financial situation or needs. An investor should, before making any investment decisions, consider the appropriateness of the information in this article, and seek professional advice, having regard to the investor’s objectives, financial situation and needs. This article is solely for the use of the party to whom it is provided.

Demographic trends promise something priceless. By observing the changing structure of a population’s age and income, patient investors who accurately forecast these slow-moving trends can benefit clients over the long term.

In the near term, these societal changes can seem a little muddy, and subject to unpredictable influences. Recently, record levels of immigration boosted Germany’s workforce, changing its demographic make-up, while China reversed its one-child policy in a move aimed at confronting problems posed by its ageing society.1

At a higher level, it can be difficult to determine the best course of action amid those trends, but a deeper investigation into how they affect companies, industries and, eventually, entire economies, is a powerful tool when it comes to making profitable investment decisions.

Our analysts explore some current demographic investment themes below:

Protein consumption

Global demand for protein is rising, driven mainly by health-obsessed millennials and the emerging middle classes in Asia.

A growing number of millennials are making the shift to plant-based protein, with a 600 per cent increase in the number of people identifying as vegans in the US in the last three years, while in Asia, animal-based protein is still the main growth driver. 2

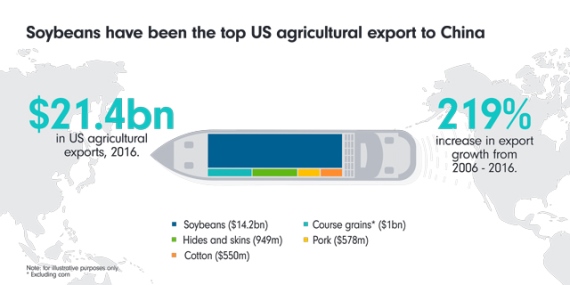
Growing prosperity in the region means that more Asians are able to afford to consume meat. Demand for pork in China has soared so much that half of the world’s pigs are now reared there. Feeding this ever-increasing livestock population is a challenge, as it takes about three kilograms of feed to produce each kilogram of meat. Soybeans, which are mainly grown in the sunny corn belt of the US and South America, are the main source of animal feed. China is the world’s largest consumer of soybeans, and until recently was one of the biggest importers of US soybeans.

But the humble soybean has become a casualty of the increasingly bitter trade war between the US and China. Brazil is the world’s biggest soybean shipper and it is set to be the biggest beneficiary of the Chinese tariffs on US soybeans, which have sent prices of US soybeans tumbling. The escalating trade dispute is disrupting the supply chain, giving agricultural trading companies such as Archer Daniels Midland and Bunge a bigger and more complex role. These types of companies could potentially benefit from increased volatility in the market for agricultural goods, boosting their returns after years of global oversupply of food commodities reduced trading opportunities.
Source: USDA, May 2017

Chocolate

Chocolate is another commodity enjoying a sweeter outlook, helped by falling cocoa prices and increasing Asian demand.

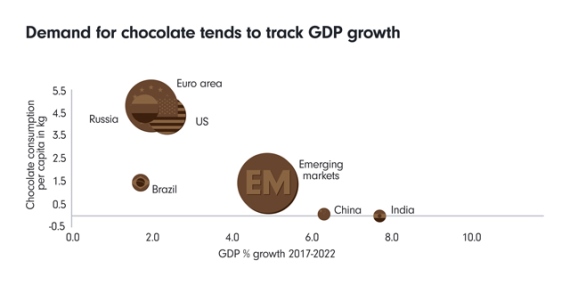
Chocolate consumption growth in emerging markets tends to closely track GDP growth. The chocolate industry in China will expand from $2.8 billion today to $3.9 billion by 2021.3] It takes 19 minutes for the average worker to earn enough to buy a bar of chocolate in China, making it more a treat for the wealthier set. 4

Asia is an underpenetrated market compared with developed countries. For instance, per capita consumption of chocolate in Switzerland is 8.8 kilograms a year, a lot more than the 100 grams a year consumed by the average person in China or the 200 grams in India.5

One of the main obstacles to closing this gap is the difficulty in selling luxury chocolate that doesn’t melt in the warmer Asian climates. Many manufacturers are pushing ahead with sales of ‘heat-resistant’ chocolate, which can withstand temperatures of up 38 degrees Celsius, without sacrificing taste.6 Heat-resistant chocolate is not new – Hershey provided the US army with heat-resistant bars during the Second World War. But with stagnating home markets, manufacturers are now looking to expand to newer economies. Barry Callebaut, Mondelez and Nestle have all developed their own versions of this type of chocolate.7
Source: Euromonitor, IMF and Global Bank, July 2018

Oral care

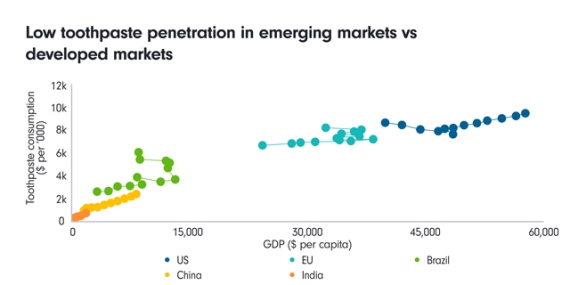
Oral care will benefit from the dual demographic trends of growing affluence in developing economies and ageing populations. In some emerging markets, frequency of brushing, and toothpaste use are still low, suggesting ample room for growth. For instance, the American Dental Association recommends 1 milliliter of toothpaste per brush, but the average toothpaste use per day is only 0.64 milliliters China and 0.35 milliliters in India.8 As countries become wealthier, people can be expected to trade up to more expensive oral goods, such as whitening products.

Some 27 per cent or 1.9 billion of the world’s population are children, so the market potential is likely to grow as they reach adulthood and begin to more seriously take care of their teeth. The need for specialised and often more expensive oral care products will also grow as people age.

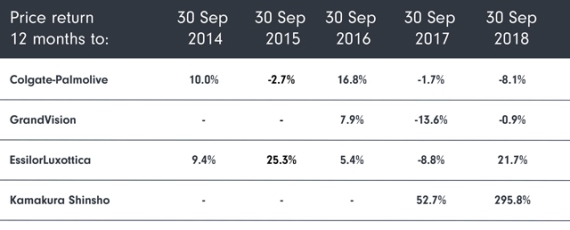
Consumer care company Colgate-Palmolive specialises in oral and personal products. It is active in emerging markets, and will benefit from growing populations and rising incomes in emerging markets such as India and Brazil.
Source: Euromonitor, 2016

Obesity

Rising incomes in emerging economies are changing eating patterns, as consumers move from healthy, low-calorie diets that are high in grains and vegetables to higher-calorie, Western-style diets that contain more meat, dairy and sugar. These dietary changes, combined with urbanisation, less physically demanding lifestyles and greater use of transport, have led to a surge in ‘western’ conditions such as obesity, which is a major driver of other lifestyle-related illnesses such as cardiovascular diseases and type two diabetes.

A drug to combat obesity has so far proved elusive, but an oral obesity pill that will be sent to the US regulator FDA early next year, for a potential launch in the US in 2020, could be the first step in tackling the world’s obesity crisis.9
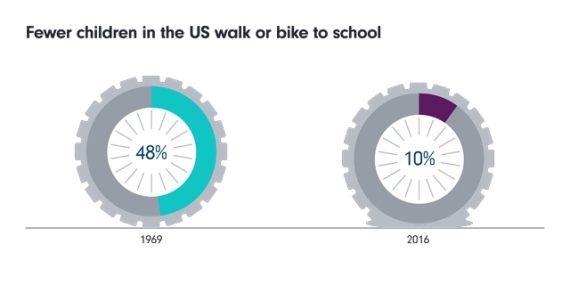
Source: National Center for Safe Routes to School, US Centers for Disease Control and Prevention

Diabetes

The number of people globally with diabetes is projected to rise from 425 million in 2017 to 629 million in 2045. Currently, there are some 187 million diabetes sufferers in India and China, and this number is expected to rise to over 250 million by 2045.10

The total cost of diabetes has been estimated at more than $720 billion in 2017 and of this, more than 80 per cent is indirectly related to diabetes – cardiovascular diseases, blindness, renal/dialysis, amputation and general hospitalisation.11

Technological advances will make diabetes easier to treat. The most exciting of these are the continuous glucose monitoring (CGM) devices, which are currently used by only 3 per cent of type two diabetes sufferers. New devices tend to be smart-phone enabled so that users can monitor their glucose levels unobtrusively through the day, and they also do not require the 5-7 daily finger prick calibrations. These devices could take off in emerging markets such as China and India, which are two of the world’s biggest smartphone markets.
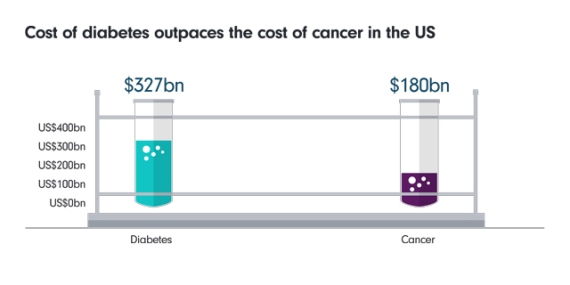
Source: American Diabetes Association, American Cancer Society, 2017

Home dialysis kits

Prediabetes, an early sign of the onset of diabetes, affects an estimated 84 million in the US – 90 per cent of whom are unaware they have this.12

Diabetes, if left unchecked, leads to kidney problems that may require dialysis – a procedure to remove waste products and excess fluid from the blood when the kidneys stop working properly. With renal failure affecting an increasingly younger population, and with extended working lives, dialysis requiring hospital treatment could be disruptive to work and careers. Home dialysis kits offer a safe and sterile option, which could transform the way this condition is treated.
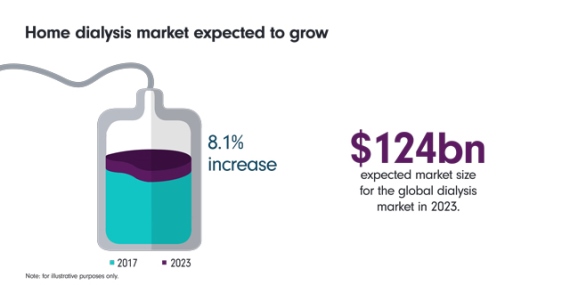
Source: KBV Research, February 2018

Eyecare

The global eyecare market is expected to grow at around 5 per cent annually between 2017 to 2022, with sunglasses growing at 6.5 per cent, eyeglasses at 5.3 per cent, and contact lenses at 4.3 per cent. This trend is mostly driven by the growing elderly population, as well as the increasing use of screens and less time spent outdoors. In 2017, around 2.5 billion people lived with uncorrected vision problems. This number is expected to rise to 3.3 billion by 2050.13

Companies such as GrandVision, which benefit from ageing populations and underpenetrated markets, are also well insulated from online disruption as the physical touchpoint of an eye exam is still essential in most cases. The merger of Essilor and Luxottica is also aimed at benefiting from the strong global growth drivers in the eyecare market.

Vision correction could have a huge impact on overall economic activity. A recent study published in the Lancet journal found that productivity among tea-pickers in the Indian state of Assam rose by 21 per cent when half over the age of 40 were given simple reading glasses. Tea-pickers over the age of 50 recorded even bigger gains, at 31 per cent.14
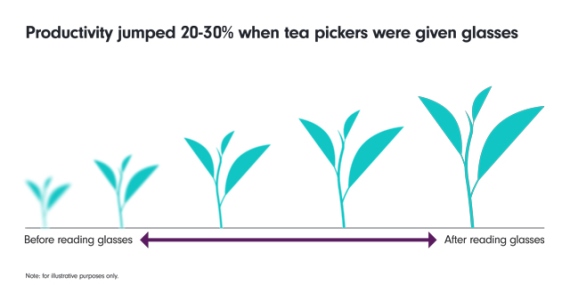
Source: The Lancet Global Health, July 2018

Smart Homes

Anyone with elderly relatives knows how much time and resources can be spent on arranging their care, or simply worrying about them. Technology allows residents to centrally control their homes’ thermostats, lighting, audio and security systems. As the elderly population grows, these digital technologies are increasingly being used to help seniors remain independent if they prefer to remain in their own homes.

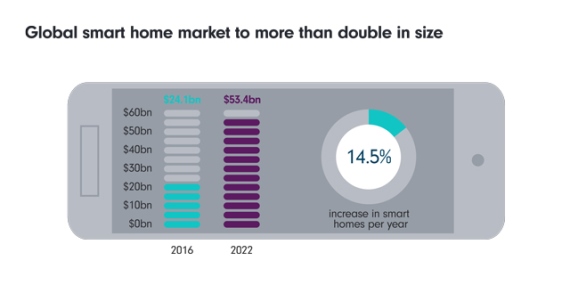
Examples of these smart technologies include activity sensor systems that detect abnormalities in seniors’ routines and alerts caregivers if help is needed. The global smart home market was valued at around $24.1 billion in 2016 and is expected to grow to $53.45 billion by 2022, an increase of over 14.5 per cent each year.15

A report by the Institution of Mechanical Engineers said the UK’s National Health Service could save billions of pounds each year by installing smart technologies in the homes of older people, allowing them to remain mobile.16
Source: Zion Market Research, August 2018

Anti-ageing products

Ageing populations and longer average lifespans mean more women – and increasingly men – are looking for all the help they can get to maintain their youthful appearances. Greater wealth in emerging economies will mean growing demand for products like skincare, anti-wrin

kle creams and hair colouring products, as well as for services such as Botox, plastic surgery and liposuction.

This trend overlaps with healthcare, as hospitals cash in on anti-ageing medical tourism and offer wellness retreats at spa-like facilities, often as part of package deals with aesthetic procedures.

The global market for anti-ageing products was estimated to be worth $140.3 billion in 2015 and is expected to reach $216.52 billion by 2021.17

Source: Telegraph, August 2018, Zion Research, August 2018

Funeral services

The old adage that the only certainties in life are death and taxes means that demand for funeral providers is reliably steady. However, the way they market and deliver their services is changing.

The global death care services market was valued at $98.3 billion in 2017, with Asia Pacific, the largest geographic region, accounting for $36.9 billion or 37.6 per cent of the global market.18

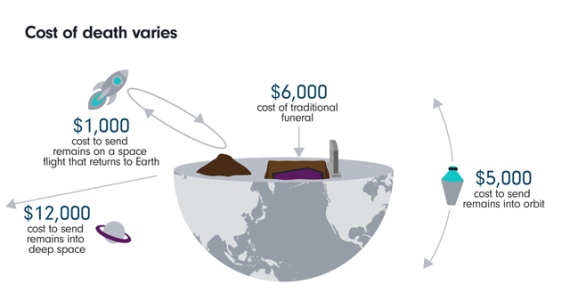
Rising incomes in emerging markets means more people will be able to afford upscale send-offs for their loved ones. In addition to the traditional burial plots, cremation, urns, headstones and flowers, some funeral packages can include blasting the deceased person’s ‘cremains’ into space. Rising costs mean more consumers are likely to plan ahead, through products such as funeral insurance.

Historically, consumers did not turn to the Internet for services such as travel and banking, where online availability is now taken for granted, and such e-commerce growth opportunities can be found in the funeral planning sector as well. The people whose parents are now passing away are among the first generation to book funeral services online, to the benefit of companies such as Japan’s Kamakura Shinsho.
 

Source: TechCrunch, 2013

Automation/Robotics

Countries such as Japan, which face shrinking labour forces, are already turning to automation to replace human workers, and this trend is expected to continue. Automation is also playing a greater role as emerging countries develop their domestic industries.

The industrial robotics market is expected to grow by 175 per cent over the next decade, and a 2017 projection by International Development Corporation predicted that 30 per cent of the world’s biggest manufacturers will have deployed cyber-physical robotic systems, resulting in a 10-20 per cent productivity increase.19

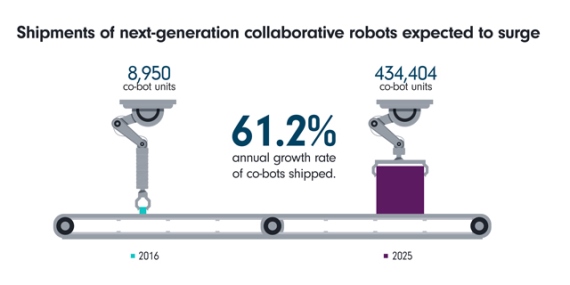
The next generation of industrial robots, called collaborative robots or ‘co-bots,’ incorporate artificial intelligence and motion sensing ability, with which they can work more safely and efficiently alongside human workers, and require less sophistication to programme. Loup Ventures said in a report last year that it expects total co-bot units shipped to increase to 434,404 by 2025 from 8,950 in 2016, representing a compound annual growth rate of 61.2 per cent.20

Finding growth areas within automation will mean looking beyond factory assembly lines, and thinking outside the box at consumer trends. For example, as demand for dairy products grows in China and India, the global market for milking machines is expected to rise 11.8 per cent to $2.61 billion by 2025.21
Source: Loup Ventures, July 2017

Conclusion

The world will always be an uncertain place for investors. But some factors, such as the emerging power of consumers in China and India, a growing global middle class and an ageing population, are less uncertain than others.

With some close monitoring of these trends, that rare and valuable snapshot of a future world can be put to good use in the financial markets.
 

Source: Refinitiv, Fidelity International, October 2018

Past performance is not a reliable indicator of future returns

[1]World Economic Forum, April 2017

[2]Global Data: Top trends in prepared foods 2017, June 2017

[3]Barry Callebaut, January 2018

[4]Euromonitor, October 2017

[5]Statista, 2017

[6]Financial Times, December 2015

[7]Confectionary News, October 2014

[8]MarketWatch, July 2017

[9]Reuters, February 2018

[11] International Diabetes Federation, Diabetes Atlas, 2017,Bernstein Analysis

[12]Centers for Disease Control and Prevention, June 2018

[13]Essilor, March 2018

[14]The Lancet Global Health, July 2018

[15]Zion Market Research, September 2018

[16]Institution of Mechanical Engineers, February 2018

[17]Zion Market Research, August 2018

[18]The Business Research Company, February 2018

[19]International Development Corporation, November 2017

[20]Loup Ventures, July 2017

[21]Million Insights, June 2018

Source : Fidelity December 2018 

Reproduced with permission of Fidelity Australia. This article was originally published at https://www.fidelity.com.au/insights/investment-articles/how-to-profit-from-demographics/

This document has been prepared without taking into account your objectives, financial situation or needs. You should consider these matters before acting on the information. You should also consider the relevant Product Disclosure Statements (“PDS”) for any Fidelity Australia product mentioned in this document before making any decision about whether to acquire the product. The PDS can be obtained by contacting Fidelity Australia on 1800 119 270 or by downloading it from our website at www.fidelity.com.au. This document may include general commentary on market activity, sector trends or other broad-based economic or political conditions that should not be taken as investment advice. Information stated herein about specific securities is subject to change. Any reference to specific securities should not be taken as a recommendation to buy, sell or hold these securities. While the information contained in this document has been prepared with reasonable care, no responsibility or liability is accepted for any errors or omissions or misstatements however caused. This document is intended as general information only. The document may not be reproduced or transmitted without prior written permission of Fidelity Australia. The issuer of Fidelity Australia’s managed investment schemes is FIL Responsible Entity (Australia) Limited ABN 33 148 059 009. Reference to ($) are in Australian dollars unless stated otherwise.
© 2018. FIL Responsible Entity (Australia) Limited.

Important:
This provides general information and hasn’t taken your circumstances into account. It’s important to consider your particular circumstances before deciding what’s right for you. Any information provided by the author detailed above is separate and external to our business and our Licensee. Neither our business, nor our Licensee take any responsibility for any action or any service provided by the author.

Any links have been provided with permission for information purposes only and will take you to external websites, which are not connected to our company in any way. Note: Our company does not endorse and is not responsible for the accuracy of the contents/information contained within the linked site(s) accessible from this page.


Combining work and family responsibilities can be a balancing act so here are some of the expenses you might face as well as potential benefits

For most working parents, the first thing that comes to mind when thinking about returning to work after having a baby is finding suitable childcare.

Statistics show that 47% of couples and 51% of single parents with children under the age of five use paid childcare, and of those, 85% of couples and 67% of single parents are using childcare for work-related purposes1.

So unless you’re fortunate enough to have family who are willing and able to care for your little one for nothing, returning to work means you’re probably adding a new outgoing to your family budget.

The government offers a Child Care Subsidy to help families with the cost of childcare. But even with government assistance taken into account, childcare can be a considerable cost, and one that has risen significantly over recent years.

Even taking into account any childcare benefit, the median amount spent per week per child was $162 for couple families and $114 for single parents in 2014 and 2015, which was an increase of 75% and 104%, respectively, on the amount spent in 2002 and 20031.

Long-term benefits of returning to work

If the cost of childcare will take up a large portion of your salary, returning to work might not seem to make good financial sense, particularly if you’re working part time. But it’s important to take a long-term view of your family finances, as well as considering the more immediate costs. After all, your children won’t be in childcare forever!

By returning to work after taking parental leave – even if it’s part time –  you’re continuing to build your super, as well as maintaining your industry knowledge, contacts, and skills, which will help protect your ability to both earn an income in the short term and build your future earning capacity. This will help protect your family’s long-term financial security, as well as helping you create a sustainable work/life balance.

How to deal with less income

If you’re like many Australian families you could be facing a reduced income due to the cost of childcare, or because you’ve changed your working arrangements, and are returning in a part-time role or job share.

Here’s a tip to help you adjust to the change, as well as some good ideas to help keep your finances on track.

  • Ensure you have a budget, which sets out how your money will be spent, and look for any areas you can reduce your spending. If you need assistance please contact us on Phone: 07 5641 4134

What to do with any extra income

If you’re returning to work when your children are at school this could mean a boost in your household income, and you may be lucky enough to have money left over after all your expenses are met. If so, there are a number of things you could do to help you get ahead financially such as:

  • Making additional repayments on your home loan

  • Repaying an outstanding uni debt, or any other debts

  • Making additional contributions to your super

  • Saving for future expenses, such as your child’s education.

As a parent, there are some other important financial matters you should think about.

  • Make sure you have enough insurance to help protect your loved ones should anything happen to you.

  • Make a will if you don’t already have one or update your existing will to reflect your change in circumstances.

  • Make sure your beneficiaries are up to date in your super.

Need more help?

If you’d like help organising your family finances and planning your return to work, speak to us on Phone: 07 5641 4134.


1 Melbourne Institute, The Household, Income and Labour Dynamics in Australia (HILDA) Survey 2017, Table 2.11, pg 23

2 Melbourne Institute, The Household, Income and Labour Dynamics in Australia (HILDA) Survey 2017, Table 2.13, pg 24

Source : AMP January 2019

 Important information:This information is provided by AMP Life Limited. It is general information only and hasn’t taken your circumstances into account. It’s important to consider your particular circumstances and the relevant Product Disclosure Statement or Terms and Conditions, available by calling 13 30 30, before deciding what’s right for you. Read our Financial Services Guide for information about our services, including the fees and other benefits that AMP companies and their representatives may receive in relation to products and services provided to you. All information on this website is subject to change without notice. Although the information is from sources considered reliable, AMP does not guarantee that it is accurate or complete. You should not rely upon it and should seek professional advice before making any financial decision. Except where liability under any statute cannot be excluded, AMP does not accept any liability for any resulting loss or damage of the reader or any other person

Sleeping under the stars is an unforgettable experience.

For some, the thought of camping is a scarier prospect than a visit to the dentist. However, with good advice and preparation, camping is extremely rewarding.

There’s something special about embracing the great outdoors; being in touch with nature and enjoying the simple life. And we can help to make your first camping adventure a memorable one.

These handy tips – some suggested by our social media followers – should inspire you to embrace the tent. Happy camping!


Making a checklist ensures packing is a much easier process.

Part one: Before you reach your campsite

Pack wisely: While it’s important to have the essentials, there’s no need to pack as if you’re going on a six-month voyage to Antarctica. Avoid stress and be sensible and efficient when packing. And make a checklist.

The same rule applies if purchasing camping gear. First-time campers can be like novice golfers, feeling the need to spend a small fortune on every single gadget available, down to the ZX4000 ultra-fast tent peg sharpener. While we hope you have repeat usage from your camping gear, it’s costly if you don’t use the equipment much. Keep it simple: buy only essentials items and build on your camping gear as you go.

An ingenious suggestion we received through the BIG4 Facebook page was for first-time campers to choose a campsite within close range of a hardware store. This way, you can easily grab a spare item or three in case you are ill-prepared.

“First-time campers can be like novice golfers, feeling the need to spend a small fortune on every single gadget available, down to the ZX4000 ultra-fast tent peg sharpener.”

Be prepared for rain: Conspiracy theorists will tell you Mother Nature likes to play havoc with campers – some even suggest their mere presence at a campsite could provide relief to drought-stricken areas. To ensure the scoreline is You 1, Mother Nature 0, be prepared for wet-weather camping.

Firstly, check that your tent is rainproof before departure. Pack a raincoat and boots and place a spare set of clothes in a waterproof bag for extra insurance.

Be sure to pack a tarpaulin or two; these are also useful to protect against the sun and wind. And bring along plastic bags and ziplock bags – they always seem to come in handy for storing items when it rains.

Remember that weather can be interchangeable: While the weather forecast might predict a run of warm days, it’s important to be prepared for interchangeable weather when camping. Warm clothes may be even required when camping in summer: in some places, overnight temperatures are capable of plummeting faster than a waterfall.

Year-round items worth packing when camping include earplugs and a comfortable chair.


Camping can be an extremely enjoyable experience for children.

Expect all conditions: In light of extremes in the weather, be armed with back-up activities in case the elements are not working in your favour. A bored camper is not a happy camper.

Make a cooking checklist: Remember that you might not have access to all your regular cooking utensils and equipment – so make a checklist of essential items. Be practical: plastic or disposable cutlery, crockery, mugs, and cups are ideal when camping.

“A bored camper is not a happy camper.”

Invite experienced campers to join you: If you have trepidation about going alone, coax experienced campers to come along for the ride – they may be able to share valuable advice.

Consider a trial run: Particularly if camping with children. Even a simple exercise like pitching a tent in your backyard can go a long way to making it easier when it comes time for the ‘real thing’.

A trial run in the backyard is a great way to prepare yourself for camping.

Part two: When at your campsite.

Check the ground: Before you set up, check the ground under which the tent will stand and clear away any loose objects. This will ensure greater comfort.

Prepare for rain (again): If it’s raining, keep bedding and other items away from the walls of your tent to avoid rain leaking through to the inside. We won’t explain the exact science behind it, but trust us – this simple advice will save you a world of pain.

Be aware of restrictions during fire season: Conversely, be aware of fire bans and restrictions in the area you are travelling, otherwise you could be up for a hefty fine. Of greater concern, you don’t want to be responsible for starting an out-of-control fire.

Socialise with fellow campers: Don’t be shy when camping – socialise with your fellow campers. It’s enjoyable and you may even pick up some handy hints along the way.

“If it’s raining, keep bedding and other items away from the walls of your tent to avoid rain leaking through to the inside.”

Consider an upgrade

Still not convinced? Well, there’s a suitable compromise thanks to the emergence of ‘glamping’ (glamorous camping). With this trend you can experience the joys of ‘roughing it’ without having to forsake any of your creature comforts. It’s a win-win situation!

Several BIG4 Holiday Parks offer safari-style tents that fall straight into the glamping category. This accommodation option comes complete with ready-made tents – no setting up is required – and some even include amenities such as a shower, fridge, and microwave.

Safari tents provide an extra level of comfort.

Isn’t it time you began creating priceless camping memories? Book your BIG4 camping holiday now.

Source : BIG4 Holiday Parks

Reproduced with the permission of BIG4 Holiday Parks. This article first appeared on BIG4.com.au and was republished with permission.

Important:
Any information provided by the author detailed above is separate and external to our business and our Licensee. Neither our business, nor our Licensee take any responsibility for any action or any service provided by the author.

Any links have been provided with permission for information purposes only and will take you to external websites, which are not connected to our company in any way. Note: Our company does not endorse and is not responsible for the accuracy of the contents/information contained within the linked site(s) accessible from this page.



Scepticism about China’s economic success amongst (mostly western) investment commentators has been an issue for as long as I can remember. The current China worries mainly relate to slowing growth, high debt and the trade dispute with the US. China is now the world’s second largest economy and its biggest contributor to growth so what happens in China has big ramifications globally. This is particularly so in Australia as China is its biggest export destination. This note looks at the main issues and what it means for investors and Australia.

Is growth slowing a little or a lot?

China slowed through 2018. GDP growth for the whole of 2018 came in at 6.6% which was a bit above our expectation of 6.5%, but it was down from 6.8% growth in 2017 and momentum slowed to 6.4% year on year in the December quarter. Some commentators argue that China’s actual GDP growth is much weaker – maybe just half the reported rate. The argument often runs along the lines that the GDP data comes out too early after the end of each quarter, it’s too smooth to be believed and that it’s made up to suit the annual growth target. This speculation has long been around and I’ve always thought it’s a bit of a distraction: it stands to reason that emerging countries like China have less to spend on stats so they may be less accurate than in rich countries, and if China’s economy is really a lot smaller than it claims then why is the rest of the world so concerned about a slowdown in its economy? And why is the US concerned about its rising economic clout? The bottom line is that it’s all too academic to get too hung up on and so I tend to see the GDP data as a rough, but admittedly imperfect, guide.

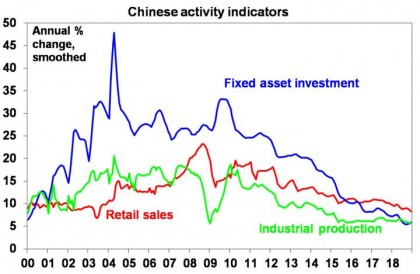
So what does other data say? As can be seen in the next chart, growth in industrial production, retail sales and fixed asset investment all slowed through 2018 to multi-year lows, albeit it’s all still pretty solid compared to most other countries. 


Source: Thomson Reuters, AMP Capital

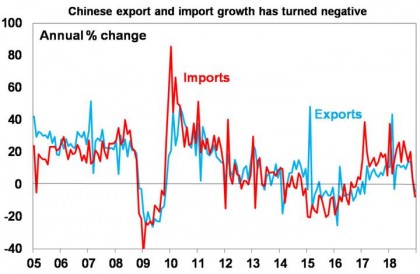
Annual growth in exports and imports also went negative in December and the weakness in exports could have further to go given that they were arguably artificially boosted as Chinese exporters/US importers sought to “front run” US tariffs.


Source: Bloomberg, AMP Capital

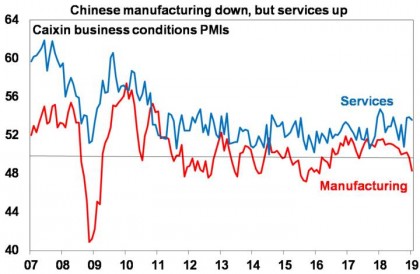
Chinese manufacturing conditions PMIs have also fallen sharply. See the next chart.


Source: Bloomberg, AMP Capital

For those sceptical of official Chinese data, I have shown the private sector Caixin survey but it’s a similar message from the official PMI survey, ie manufacturing has slowed.

While concerns about the trade war may have contributed to the slowdown, the main driver so far appears to be tighter credit conditions aimed at slowing debt growth via the less regulated “shadow banking” system. This would explain why smaller businesses are doing it tough relative to larger businesses.

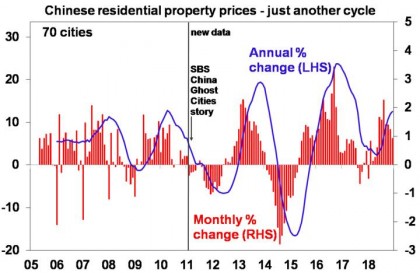
However, it’s not all doom and gloom. First, the housing sector has been doing well with house prices rising.


Source: Bloomberg, AMP Capital

Second, while manufacturing has slowed, services has continued to hold up well. This is evident in relatively solid readings for the services conditions PMIs (in both the official and Caixin PMIs) of around 54 in contrast to weaker manufacturing PMIs – see the second chart above. Services are less affected by trade wars and the services sector is expanding relative to the manufacturing sector. Out of interest this may partly explain why GDP growth in China is now smoother and does better than expected with most commentators focusing on the old manufacturing sector.

Finally, policy stimulus is ramping up…

Policy easing

In response to the growth slowdown, China has moved to start providing significant policy stimulus with the People’s Bank of China cutting the required reserves that banks have to keep (allowing them to lend out more) and the government recently announcing fiscal stimulus focused on tax cuts for households and small businesses but also infrastructure spending amounting in total to 2-3% of GDP for this year. With public debt and inflation relatively low there is little constraint on policy stimulus except to avoid another big ramp up in debt, which is why stimulus is now more focused on tax cuts than debt-related investment. Which in turn means more of a boost to services demand in China than to global commodity demand and a less certain impact than was seen from the 2008 and 2015-16 stimulus programs.

Growth and inflation outlook

We expect Chinese growth this year to slow further in the short term particularly as exports weaken after front running, but policy stimulus should help head off a deeper downturn and see growth improve in the second half. But it’s more aimed at preventing a sharp downturn in growth rather than pushing growth a lot higher. So overall growth is expected to be around 6.2% this year which is still a bit slower than last year’s 6.6% growth rate. Inflation is likely to remain low.

What about China’s “debt time bomb”?

This is the most commonly expressed concern about China, with the ratio of non-financial debt to GDP having increased very rapidly from around 150% a decade ago to nearly 300% now. This has caused some to fear a financial catastrophe for China. However, China’s debt problems are different to most countries. First, China has borrowed from itself – so there’s no foreigners to cause a foreign exchange crisis. Second, much of the rise in debt owes to corporate debt that’s partly connected to fiscal policy and so the odds of a government bailout if things go wrong are high. Finally, the key driver of the rise in debt in China is that it saves around 45% of GDP (roughly double that in developed countries) and most of this is recycled through the banks where it’s called debt. So unlike other countries with debt problems, China needs to save less and consume more, and it needs to transform more of its saving into equity rather than debt. Chinese authorities are aware of the issue and overall growth in debt has slowed but slamming on the debt brakes without seeing stronger consumption makes no sense. But boosting consumption will take time and will involve moving to a more progressive tax system and enhanced social welfare.

What about the trade war?

While the tariff increases that have actually been implemented so far in the US/China trade war are relatively small the threat of more to come has clearly adversely affected confidence (and thus investment) in both countries. Trade negotiations between the US and China are reportedly progressing well but big differences apparently still remain. The pressure from slowing growth on both sides means that both China and the US are under pressure to reach a deal though – notably President Trump who doesn’t want to see recession or an extended bear market derail his 2020 re-election prospects. As such we see roughly an 80% chance that a deal is reached – either before the March 1 deadline for negotiations or after an extension.

The Chinese share market

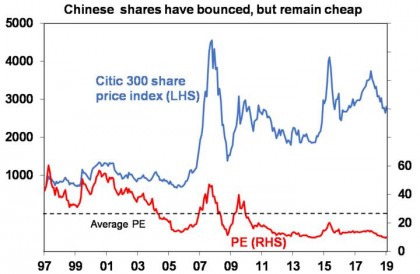
Chinese shares have bounced 9% from their December low. But they had a 32% top to bottom fall last year and are still cheap trading on a price to forward earnings ratio of just 10 times (compared to 14.7 times for Australian shares) which is about as cheap as they ever get. See the next chart.


Source: Thomson Reuters, AMP Capital

They may have a short-term pullback as growth slows further in the first half, but with valuations cheap they should perform well on a 12-month horizon as growth and hence profits improve through the second half.

Implications for Australia

A sharp slowdown in China would be a double whammy for the Australian economy coming at the same time as the housing downturn. But while it’s a risk it’s not our base case. Rather our outlook for China’s economy to stabilise and growth to pick up a bit in the second half implies a reasonable – but not spectacular – outlook for commodity prices. Combined with the spike in iron ore prices on the back of Vale’s problems (albeit temporary) it points to reasonable growth in export earnings, which will be one source of support helping to counter the housing downturn. Reasonable commodity prices will help prevent a sharp drop in the $A, but we still see it falling into the $US0.60s as the RBA cuts the cash rate to 1% this year.


Source: AMP Capital 7 Feb 2019

Important notes: While every care has been taken in the preparation of this article, AMP Capital Investors Limited (ABN 59 001 777 591, AFSL 232497) and AMP Capital Funds Management Limited (ABN 15 159 557 721, AFSL 426455) makes no representations or warranties as to the accuracy or completeness of any statement in it including, without limitation, any forecasts. Past performance is not a reliable indicator of future performance. This article has been prepared for the purpose of providing general information, without taking account of any particular investor’s objectives, financial situation or needs. An investor should, before making any investment decisions, consider the appropriateness of the information in this article, and seek professional advice, having regard to the investor’s objectives, financial situation and needs. This article is solely for the use of the party to whom it is provided.

At its meeting today, the Board decided to leave the cash rate unchanged at 1.50 per cent.

The global economy grew above trend in 2018, although it slowed in the second half of the year. Unemployment rates in most advanced economies are low. The outlook for global growth remains reasonable, although downside risks have increased. The trade tensions are affecting global trade and some investment decisions. Growth in the Chinese economy has continued to slow, with the authorities easing policy while continuing to pay close attention to the risks in the financial sector. Globally, headline inflation rates have moved lower due to the decline in oil prices, although core inflation has picked up in a number of economies.

Financial conditions in the advanced economies tightened in late 2018, but remain accommodative. Equity prices declined and credit spreads increased, but these moves have since been partly reversed. Market participants no longer expect a further tightening of monetary policy in the United States. Government bond yields have declined in most countries, including Australia. The Australian dollar has remained within the narrow range of recent times. The terms of trade have increased over the past couple of years, but are expected to decline over time.

The central scenario is for the Australian economy to grow by around 3 per cent this year and by a little less in 2020 due to slower growth in exports of resources. The growth outlook is being supported by rising business investment and higher levels of spending on public infrastructure. As is the case globally, some downside risks have increased. GDP growth in the September quarter was weaker than expected. This was largely due to slow growth in household consumption and income, although the consumption data have been volatile and subject to revision over recent quarters. Growth in household income has been low over recent years, but is expected to pick up and support household spending. The main domestic uncertainty remains around the outlook for household spending and the effect of falling housing prices in some cities.

The housing markets in Sydney and Melbourne are going through a period of adjustment, after an earlier large run-up in prices. Conditions have weakened further in both markets and rent inflation remains low. Credit conditions for some borrowers are tighter than they have been. At the same time, the demand for credit by investors in the housing market has slowed noticeably as the dynamics of the housing market have changed. Growth in credit extended to owner-occupiers has eased to an annualised pace of 5½ per cent. Mortgage rates remain low and there is strong competition for borrowers of high credit quality.

The labour market remains strong, with the unemployment rate at 5 per cent. A further decline in the unemployment rate to 4¾ per cent is expected over the next couple of years. The vacancy rate is high and there are reports of skills shortages in some areas. The stronger labour market has led to some pick-up in wages growth, which is a welcome development. The improvement in the labour market should see some further lift in wages growth over time, although this is still expected to be a gradual process.

Inflation remains low and stable. Over 2018, CPI inflation was 1.8 per cent and in underlying terms inflation was 1¾ per cent. Underlying inflation is expected to pick up over the next couple of years, with the pick-up likely to be gradual and to take a little longer than earlier expected. The central scenario is for underlying inflation to be 2 per cent this year and 2¼ per cent in 2020. Headline inflation is expected to decline in the near term because of lower petrol prices.

The low level of interest rates is continuing to support the Australian economy. Further progress in reducing unemployment and having inflation return to target is expected, although this progress is likely to be gradual. Taking account of the available information, the Board judged that holding the stance of monetary policy unchanged at this meeting would be consistent with sustainable growth in the economy and achieving the inflation target over time.

Source: Reserve Bank of Australia, February 5th, 2019

Enquiries

Media and Communications
Secretary’s Department
Reserve Bank of Australia
SYDNEY

Phone: +61 2 9551 9720
Fax: +61 2 9551 8033

Email: rbainfo@rba.gov.au

While you’ve still got time on your side, check out this list of things to think about, so you can hopefully continue the party in retirement.

Life in your 20s mightn’t seem too long ago. In fact, apart from a few extra frown lines that may have appeared over the years, you might feel as though no time has passed at all.

With that in mind, the idea of considering ‘your retirement’ may sound somewhat horrific – and understandably. I mean, isn’t that something your parents did?

Reality check – reality bites! But, putting off thinking about it may not be the answer. After all, surely you still want to enjoy life in retirement, particularly if to you, age is just a number.

So, if you’re up for getting a (hopefully) not-so-scary overview of some of the things you may want to think about, while you still have time on your side, check out the list below.

Like learning to drive a car, what may seem overwhelming at first, may not be as bad as you think once you get your head around how you plan to tackle things.

1. Do I have to retire by a certain age?

You can retire whenever you want to in Australia, but your financial situation, employment opportunities, health and wanting to coordinate with your other half could play a big part.

2. How much money will I need and where will I get it?

Industry figures show individuals and couples around age 65, looking to retire today, would need an annual budget of $42,953 and $60,604 respectively to fund a comfortable lifestyle, or $27,425 and $39,442 respectively to live a modest lifestyle (which is considered better than living on the Age Pension)1. Note, these figures also assume people own their home outright and are relatively healthy2.

With this in mind, consider how you’d like to live your life in retirement and what money you may have access to, such as super, government benefits, investment returns, savings or an inheritance.

3. Have I considered what it’ll cost to do the things I enjoy?

Life expectancy in Australia is increasing3, so spare a thought for things outside of just your living costs and utility bills.

What kind of money might you need to do the things you enjoy, such as sport, keeping up with any hobbies you might have, any travel you’d like to do and how often you see yourself eating out?

4. How and when can I access my super savings?

Generally, you can start to access your super when you reach your preservation age, which will be between ages 55 and 60, depending on when you were born. As for what you do with your super (which from age 60 you can access tax free) you’ll have a few options.

You may access a portion of your super via a transition to retirement pension (TTR), which you can do while continuing to work full-time, part-time or casually if you want greater financial flexibility.

Alternatively, if you stop work altogether, you may choose to take your super as a lump sum of money, or move it into an account-based pension or annuity, if you want to receive a regular income.

There will be different tax implications for different people and remember your super doesn’t guarantee an income for life, as it will come down to how much super you’ve saved over the years.

5. Will I be eligible for government assistance?

Along with your savings, government benefits, such as the Age Pension, could be an important part of your income in retirement, if you’re eligible, which not everyone will be.

For instance, the value of various assets you have and any income you receive (in addition to other requirements) will determine whether you’re eligible for the Age Pension and what amount of money you’ll receive in Age Pension payments.

6. Will I still be paying off my current debts?

If you’re going to be carrying debt into retirement, you may want to think about ways to reduce it sooner rather than later.

Some things you might do:

  1. Work out your debts and what they total

  2. Look into whether you might benefit from rolling your debts into one

  3. Look at whether you can afford to make extra repayments

  4. Shop around for providers with lower interest rates and no annual fees.

7. Are there other things I should think about?

  • Insurance – You might have insurance, but what you require in retirement could be quite different to when you’re working.

  • Investments – You might consider a more conservative approach to anything you’re invested in, as when you’re young you often have more time to ride out market highs and lows.

  • Estate planning – You may want to document how you want your assets to be distributed after your gone and how you want to be looked after if you can’t make decisions.

8. Is it a possibility I might relocate or downsize?

Your living arrangements in retirement should be based on more than just your finances. Your health, partner, family and what activities you’re interested in will all play a part.

If you are set on moving to get money from your property, planning ahead could help you feel more in control as you can assess any out-of-pocket costs in advance.

9. Am I in a position to make additional contributions to my super?

The more you can put into super, the more money you could have when you retire. And, if you put some of your before-tax income into super, these amounts will generally be taxed at 15%, which is lower than the tax most people pay on their employment income.

Final thoughts

Procrastinating and leaving important decisions for another day is something many of us can relate to, but in reality the more time you give yourself to think these things through, the better off you may be.

The number of years we could spend in retirement may be many, so if a bit of planning can help make those years a little more fun, surely, it’s worth a bit of thought.

Please contact us on Phone: 07 5641 4134 if we can be of assistance 

Source : AMP December 2018

  Important information:This information is provided by AMP Life Limited. It is general information only and hasn’t taken your circumstances into account. It’s important to consider your particular circumstances and the relevant Product Disclosure Statement or Terms and Conditions, available by calling 13 30 30, before deciding what’s right for you. Read our Financial Services Guide for information about our services, including the fees and other benefits that AMP companies and their representatives may receive in relation to products and services provided to you. All information on this website is subject to change without notice. Although the information is from sources considered reliable, AMP does not guarantee that it is accurate or complete. You should not rely upon it and should seek professional advice before making any financial decision. Except where liability under any statute cannot be excluded, AMP does not accept any liability for any resulting loss or damage of the reader or any other person.