Buy now, pay later services do just what they say on the packet. You get to slip straight into the latest fashions, and providing you pay within the allotted time, you pay 0% interest. So far, so good.

But, like the proverbial free lunch, it’s worth looking closer. ASIC’s report1 into this rapidly expanding sector looks at potential costs and pitfalls, as well as the benefits.

What are buy now, pay later services?

Branded the modern-day layby, ‘buy now, pay later’ services essentially offer the same thing, except you get the product up front—the outfit, the watch, even certain domestic flights within Australia.

Services, such as Afterpay, Openpay and zipPay, are offered by approved retailers and provide another form of payment option when you’re shopping online and sometimes instore.

You can buy a product, take it home and pay for it in instalments via an online buy now, pay later account, which deducts your preferred debit or credit card.

Report findings

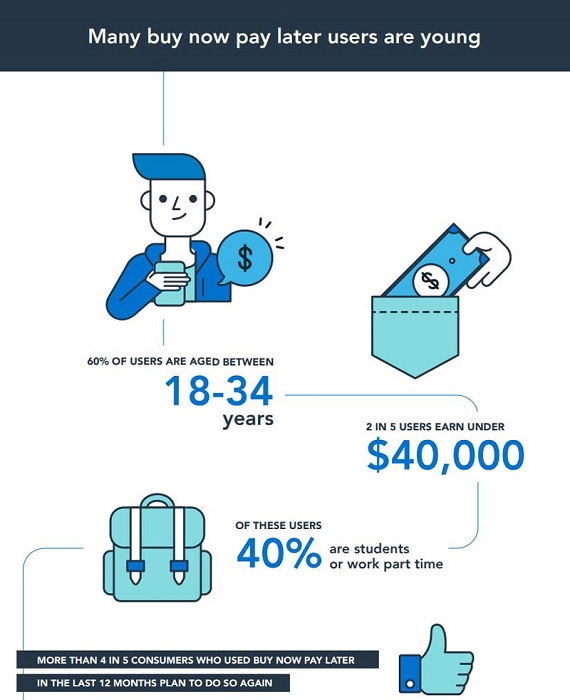
ASIC found around two million or 10% of Australians had used these services by mid-2018, a five-fold increase in two years. Most users are millennials or Generation Z, aged 18-34.
ASIC puts the spotlight on buy now, pay later, Nov 2018.

And they like the experience, with four in five of them planning to do so again. Although most users also believe that these arrangements allow them to buy more expensive items, smaller and more frequent spending is the norm. The value of average transactions over the period fell from over $1,000 to just under $180.

Only one out of the six major providers examined the income and existing debts held by consumers before providing their services. ASIC also received reports of instances where consumers used a buy now, pay later arrangement despite having limited or no income and substantial existing debt.

How do they charge?

Many buy now, pay later services are interest and fee free (if you pay on time). If a payment is scheduled to be deducted and you don’t have the money in your account, and haven’t attempted to pay what is owed via other means, you’ll typically be charged a late fee.

For this reason, it’s important you have the right amount of money in your account when each instalment is due, and that you’re across any other charges that might be payable before signing up.

According to buy now, pay later services, such as Afterpay, late fees aren’t a primary revenue driver, with the group saying that 80% of its revenue is derived from merchant fees paid by retailers2.

Another thing to consider, if you’re using your credit card, is while the buy now, pay later provider might not charge interest on your purchase, you may still have to pay interest to your credit card provider if you don’t pay the full amount owing on your credit card by the due date.

Things to consider

Price check your basket

Make sure you’re not paying more than you would if you shopped around. The Australian Securities and Investments Commission (ASIC) is considering the legal position of scenarios where a merchant inflates the cost of the underlying goods if a consumer uses a buy now, pay later arrangement.

Spending what you don’t have

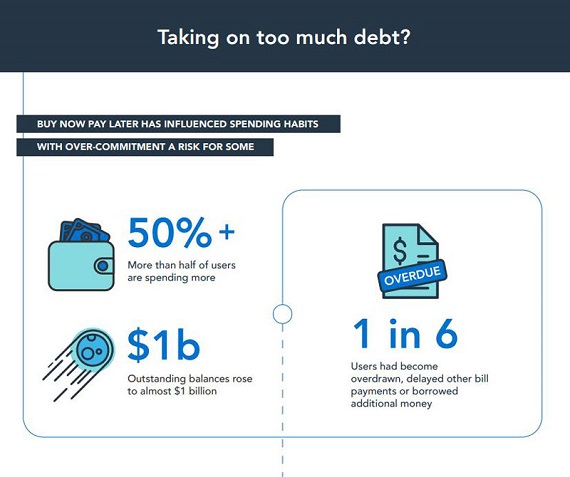
While these services can be very handy if you have available funds and can pay on time, if you don’t, little debts stemming from things like late fees can quickly snowball into bigger debts, which can have various repercussions. For this reason, it’s a good idea to have a budget in place when it comes to spending, so you don’t get in over your head.
 

ASIC puts the spotlight on buy now, pay later, Nov 2018.

Plan ahead – consider linking your account to a debit card instead of a credit card, so you don’t compound any missed payments.

How your credit rating could be affected

Many buy now, pay later services don’t check your ability to make repayments, so if you’re already in the red, further debt could mean bad news and possibly debt collectors at your door. On top of that, while buy now, pay later services might not check your history, they’re still able to report any black marks against you to credit reporting agencies, which could make it hard to borrow money in future.

If you have a customer complaint

Because you’re not going direct to the retailer when using a buy now, pay later service, you might also want to check out the provider’s dispute resolution policy so that there are no surprises if something you purchased doesn’t turn up, or you want to refund or return something that wasn’t quite right.

More information

Retail assistants may not fully understand the ins and outs of the products they’re selling. So, as with any financial contract, make sure you read it and understand the terms and conditions before you sign up to any new service provider. Ensure you’re across things like fees and various other policies so you don’t get caught out.

ASIC puts the spotlight on Buy Now Pay Later, released 28 November 2018
Afterpay Fact Sheet, p8

Source : AMP August 2019

Important:
This information is provided by AMP Life Limited. It is general information only and hasn’t taken your circumstances into account. It’s important to consider your particular circumstances and the relevant Product Disclosure Statement or Terms and Conditions, available by calling Phone: 07 5641 4134, before deciding what’s right for you.

All information in this article is subject to change without notice. Although the information is from sources considered reliable, AMP and our company do not guarantee that it is accurate or complete. You should not rely upon it and should seek professional advice before making any financial decision. Except where liability under any statute cannot be excluded, AMP and our company do not accept any liability for any resulting loss or damage of the reader or any other person. 

Say goodbye to sugar cravings, ‘hangry’ crashes and distracting thoughts through your workday with some of our favorite workday recipe essentials! 

We like to think we are pretty good at snacking in the Food Matters HQ; Find a healthy array of snacks stashed in our draw, and the weekly shopping list always including carefully thought out snacks. Healthy fats. Tick. Protein. Tick. A dose of fiber. Tick. Nourishing nutrients. Tick. These are all things are important in our snacks. 

Here Are 7 of Our Favorite Workday Healthy Snacks

Chocolate Chia Protein Balls

Quick Almond Butter Cookies with Coconut, Hemp & Flax

Gluten-Free Turmeric Seeded Loaf

Pumpkin Fritters with Zucchini Hummus


Gut-loving Beetroot Hummus


Gluten-Free Zucchini & Feta Fritters

Chili, Lime & Tamari Trail Mix


Source : Food Matters 

Reproduced with the permission of the Food Matters team. This article by Rachel Morrow was originally published at www.foodmatters.com/ recipe/our-essentials-get-through-workday

Important:
This provides general information and hasn’t taken your circumstances into account.  It’s important to consider your particular circumstances before deciding what’s right for you.  Any information provided by the author detailed above is separate and external to our business and our Licensee. Neither our business nor our Licensee takes any responsibility for any action or any service provided by the author.

Any links have been provided with permission for information purposes only and will take you to external websites, which are not connected to our company in any way. Note: Our company does not endorse and is not responsible for the accuracy of the contents/information contained within the linked site(s) accessible from this page. 

Market research indicates the average Australian home has 17 connected devices; ‘smart’ devices in the internet of things that offer everything from efficiency to safety, convenience and entertainment.1  Renewable energy devices – behind the meter, on the roof and in your pocket – are the next frontier, offering real savings and the potential to power them all.

In 1981, you could buy a personal computer (PC) for about the same price as a used car. The next screen revolution – flat screen televisions – hit the market in the late 1990s to the tune of about $15,000 for a large model.

Prices dropped rapidly over the next decade as technology improved. Research shows the average Australian home now has 6.6 screens, including internet-capable televisions, tablets, smartphones and high definition televisions.2

So it goes that breakthrough technologies seem to be underestimated and overpriced at the outset, but costs decline rapidly as the technology improves and adoption becomes widespread.

The declining cost of renewable energy

Similar dynamics can be observed in renewable energy technology.

The climate crisis upon us and finite reserves of coal and gas capture a decade-long debate about how our electricity should be produced. In mainstream debates, renewable energy is increasingly being understood as a necessity, not a choice, to future-proof energy sources for homes and businesses.

For example, in 2017, onshore wind was named the world’s cheapest way to produce electricity. Its unsubsidised levelised cost of energy (LCOE) range of US$30-60 per megawatt hour (MWh) fell below the range of the cheapest fossil fuel, natural gas (US$42-78 per MWh). Solar was right behind as the world’s second-cheapest energy source, with the high end of its LCOE range (US$43–53/MWh) less than any other generation source. Globally, Australia has the lowest costs for solar-powered generation.3

If history repeats itself, this means that as energy companies transition their portfolios to hold greater proportions of renewable electricity generation, retail energy costs should decrease over time.

In the meantime, there are savings and gains to be made by investing in distributed energy resources (DER) that generate power directly for the home and reduce the amount of energy one needs to consume. Rooftop solar is the most common, with an investment case that’s more compelling than you might think.

Myth 1: Installing renewable energy in a home is a major expense

Rooftop solar, with or without a battery for storing your power, is one of the most commonly deployed DER solutions.

Australia’s Clean Energy Council estimates 1 in 5 rooftops have solar panels installed – including 2 million homes – with 6 panels installed each minute in 2018.

Recent market surveys indicate the average price across Australian capital cities for a 5kW system without battery storage is $5,100. A system of this size is generally suitable for a family of four and takes anywhere from two to seven years to pay for itself.4

As for batteries, market research suggests they are still relatively expensive, and the payback time will often be longer than the warranty period of the battery. The current cost is between $8,000 and $15,000 (installed), depending on capacity and brand.5  It’s worth checking what’s available in your area, as there are some government schemes that offer financial incentives. At a minimum, it’s worth making sure your system is ‘battery ready’ as battery costs are declining rapidly.

Myth 2: Long-term cost-savings aren’t that significant

According to Clean Energy Council Chief Executive Kane Thornton, homes with rooftop solar are saving on average about $540 per year on their electricity bills.

This represents a 25 percent saving on the average annual electricity bill of $2,088 for a four-person home.6

According to Choice, the price of a 5kW solar system has fallen by around 58 percent in the last six years – and the technology is getting cheaper.

Looking ahead

Distributed energy resources are set to play an increasing part in Australia’s energy system. These small-scale energy solutions are forecast to dramatically increase and deliver almost half of all electricity supplied by 2050.7

Current examples of DER include rooftop solar, batteries, microturbines, fuel cells, electric vehicles and ‘demand response’ applications that moderate consumption.

Solar is the most prevalent today and, while the technology is continually improving, it is already a compelling investment that is within the reach of many.

As technologies continue to improve, the choice and benefits for investor-owners in solar and other solutions should expand.

Source : AMP CAPITAL September 2019 

Australian IoT@Home Market Study, Telsyte, 2019
Australian Video Viewing Report, Nielsen, 2018
Global renewable energy trends, Deloitte Insights, 2018
How to buy the best solar panels for your home, Choice, 2019
How to buy the best solar battery storage, Choice, 2019
What is the average electricity bill?, Canstar Blue, 2019
The Distributed Energy Integration Program, Australian Renewable Energy Agency, 2019

Important notes: While every care has been taken in the preparation of this article, AMP Capital Investors Limited (ABN 59 001 777 591, AFSL 232497) and AMP Capital Funds Management Limited (ABN 15 159 557 721, AFSL 426455)  (AMP Capital) makes no representations or warranties as to the accuracy or completeness of any statement in it including, without limitation, any forecasts. Past performance is not a reliable indicator of future performance. This article has been prepared for the purpose of providing general information, without taking account of any particular investor’s objectives, financial situation or needs. An investor should, before making any investment decisions, consider the appropriateness of the information in this article, and seek professional advice, having regard to the investor’s objectives, financial situation and needs. This article is solely for the use of the party to whom it is provided and must not be provided to any other person or entity without the express written consent of AMP Capital.

Right now, the developed world is on the cusp of a fourth industrial revolution, and it is set to have a more transformative impact on everyday life than the three revolutions before it.


The fourth industrial revolution is about embedding the cyber world into everyday lives and workplaces. The roll-out of 5G is core to this revolution, enabling technologies which can power and transform energy management, transport networks, healthcare and entertainment.

A fundamental change in how we live, work and transact will have a knock-on impact to how industrial real estate is used and valued. This disruption presents both opportunities and challenges for investors – industrial real estate will see some big wins as 5G is rolled out, but not every asset will have the potential for gains.

Read about how the fourth industrial revolution, powered by 5G, will profoundly change the nature of industrial real estate.

Author: James Maydew, BSc (Hons), MRICS, Head of Global Listed Real Estate, Sydney, Australia

Source: AMP Capital 20 Sept 2019

Important notes: While every care has been taken in the preparation of this article, AMP Capital Investors Limited (ABN 59 001 777 591, AFSL 232497) and AMP Capital Funds Management Limited (ABN 15 159 557 721, AFSL 426455) (AMP Capital) makes no representations or warranties as to the accuracy or completeness of any statement in it including, without limitation, any forecasts. Past performance is not a reliable indicator of future performance. This article has been prepared for the purpose of providing general information, without taking account of any particular investor’s objectives, financial situation or needs. An investor should, before making any investment decisions, consider the appropriateness of the information in this article, and seek professional advice, having regard to the investor’s objectives, financial situation and needs. This article is solely for the use of the party to whom it is provided and must not be provided to any other person or entity without the express written consent of AMP Capital.

Retirees now face a bold truth: investing in traditional safe haven assets do not provide the returns they once did. So, where to from here?

The first thing is to accept that today’s returns are lower on retiree favourites, like cash and bonds.

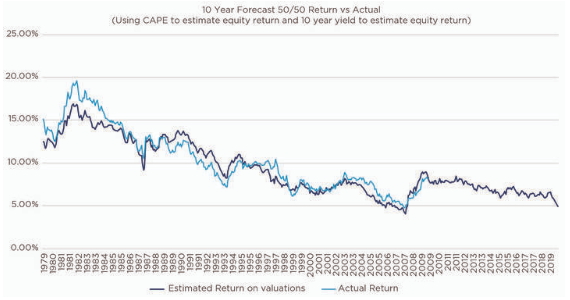
Second, there are tools available to provide forecasts for what the market will return over a 10-year period. These forecasts have been relatively reliable through history and are useful for investors who, understandably, are looking at short-term volatility and thinking there is no hope in predicting long-term patterns.


What the future could look like

In our view, investors should expect lower returns on bonds over the next 10 years than the past 10 years, simply because the starting point of today’s yields is extremely low.

Low bond yields have the potential to cause other riskier assets such as equities to trade at higher valuations and therefore also offer lower expected returns. Because of market conditions, annuities may also pay less.

The combined effect in our view is that the expected return on a simple 50/50 stocks and bonds portfolio is likely to be less than 5% p.a. over the next 10 years1. The only compensation accompanying these lower returns is that this environment is likely to produce lower levels of inflation. 


Source: Bloomberg, 30 August 2019

This is the lowest forecast return for this type of portfolio in history, matched only by those made in the run-up to the global financial crisis. In that instance, high equity valuations were driving down expected returns. This time, it’s low bond yields.

This is a very importance difference; if you were aware in 2007 that equities were the source of deterioration in your expected return, you could de-risk your portfolio into cash and bonds and still expect a reasonable result. However, in 2019, there is nowhere to hide.

To avoid the risk of holding a poorly performing asset, like cash and bonds, one option is to look beyond these conservative asset classes and take on higher levels of risk with more volatile assets. At a time when investors can least afford shocks to the downside, this is a conundrum with no simple answer.

Retirement savings, then and now

For retirees whose focus is to preserve and prolong their stockpile, all this begs the question: how large a reduction in retirement income should one expect?

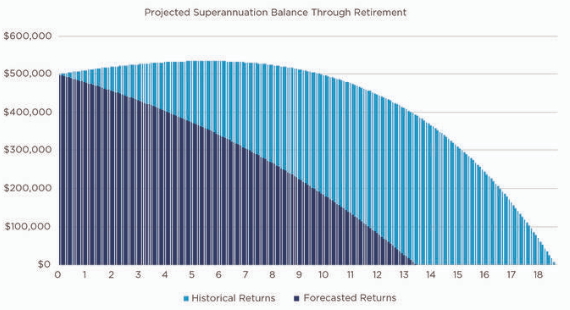
To illustrate how much lower today’s average retirement income is expected to be, we can simulate a $500,000 investment in a simple portfolio of 50% Australian government bonds and 50% Australian shares with our current expected return of 4.9% and 2.5% inflation. Before looking at the chart, consider how far this is from the 11.9% historical return and 5.3% inflation rates of the halcyon days. This is where it hits home.


Source: AMP Capital

The bottom line is: retirement savings won’t last nearly as long as they have in the past. Based on the average market return from 1969 to today, a retiree could have expected to receive a comfortable retirement income2 for 18.5 years. For retirees in 2019, that drops down to just 13.5 years.

There is no doubt that the investment environment moving forward is going to be significantly more challenging than it has in the recent past, with today’s retiree facing the prospect of some of the lowest returns in living memory.

What retirees can do?

Still, far from waving the white flag, in our view there are some things investors can do to improve their prospects.

With traditional strategies returning less in today’s environment, retirees will now more than ever reap the benefit of a good adviser. Three investment strategies which could help manage the situation are:

  1. Retirees can seek higher returns from active management. By finding managers who can outperform the market, retirees can give their returns a boost that may go some way to offsetting the impact of lower market returns.

  2. Retirees can also employ a dynamic asset allocation approach in their diversified portfolio. Dynamic asset allocation seeks to navigate the market cycle and gain exposure to asset classes that are delivering the most attractive returns. By dynamically managing their exposure to different asset classes through the cycle, retirees may be able to secure more attractive returns and better manage risk compared to a traditional ‘buy and hold’ strategy. 

  3. Retirees could consider increasing their exposure to alternative sources of return that aren’t linked to bond and equity markets and aren’t likely to suffer as badly from the low-return environment.

Additionally, retirees will benefit from an effectively constructed portfolio that minimises waste, such as transaction costs, and maximises structural advantages, such as access to franking credits. 

Unfortunately, there is no magic tonic for the situation and retirees should be wary of anyone claiming to have one. However, by partnering with a good adviser, managing their expectations and positioning their portfolio for a lower return future, they will be in the best possible position to thrive.


Author: Darren Beesley, BCom FIAA, Head of Retirement and Senior Portfolio Manager, Sydney, Australia

Source: AMP Capital 9 Oct 2019

Based on an expected 10 year return on Australian government bonds equal to current 10-year bond yield of 0.9% and expected return on equities of 8.9% based on a historical regression of 10 year returns against starting Cyclically Adjusted Price/Earnings Ratio of 20.3

As defined by ASFA’s retirement income standards

Important notes: While every care has been taken in the preparation of this article, AMP Capital Investors Limited (ABN 59 001 777 591, AFSL 232497) and AMP Capital Funds Management Limited (ABN 15 159 557 721, AFSL 426455) (AMP Capital) makes no representations or warranties as to the accuracy or completeness of any statement in it including, without limitation, any forecasts. Past performance is not a reliable indicator of future performance. This article has been prepared for the purpose of providing general information, without taking account of any particular investor’s objectives, financial situation or needs. An investor should, before making any investment decisions, consider the appropriateness of the information in this article, and seek professional advice, having regard to the investor’s objectives, financial situation and needs. This article is solely for the use of the party to whom it is provided and must not be provided to any other person or entity without the express written consent of AMP Capital.

Economic conditions, including falling cash rates at home and abroad, are prompting investors to shake up their asset allocation. This is having an impact on allocations to direct real estate worldwide.


The state of play

At its October board meeting, the Reserve Bank lowered the official cash rate by 25 basis points to 0.75 per cent.

The RBA is not alone in its fight to kick-start the national economy. Developed nations worldwide are grappling with sluggish growth and below-target inflation figures, and there’s no end in sight for the mid-term.1

“Interest rates are very low around the world and further monetary easing is widely expected, as central banks respond to the persistent downside risks to the global economy and subdued inflation”

said RBA governor Philip Lowe in his statement supporting the cash rate decision.

One well-understood impact of this lower-for-longer environment is compression of returns from traditional safe haven assets like bonds and cash. As a result, institutional and retail investors alike are on the hunt for new opportunities, and we see that manifesting in a jump in investors’ interest in direct commercial real estate.

Key market observations

In the last 12 months, commercial real estate (CRE) has delivered an average return of 4.9 per cent, placing it amongst the highest income return of all asset classes.2

Further, investors worldwide have lifted their exposure to CRE, from an average of 8 per cent in 2012 to 11 per cent today.3  At AMP Capital, we anticipate this figure will continue to rise, reaching approximately 15 per cent by 2025.

However, it’s important to note that while falling cash rates will likely prolong the real estate capital growth cycle, which is currently in its ninth year of positive capital growth, we expect yields to compress in the office and logistics space over the next 12 months, as the cost of capital falls.4

Similar patterns and projections were identified in a report from Cornell University in the United States and capital advisory firm Hodes Weill.5

Its 2018 Allocations Monitor, which includes research collected from 208 institutional investors in 29 countries, said that, on average, institutions are expected to increase target allocations to real estate by 20 basis points over the next 12 months.

Further, the research found that after two years of “moderating” portfolio investment returns, performance increased in 2017. Real estate portfolios generated an average annual investment return of 9.2 per cent in 2017, up from 8.7 per cent in 2016, according to the report.

“This is consistent with industry-wide real estate returns, which trended upward in 2017, spurred by a rebound in economic growth which led to stronger operating fundamentals (i.e. rent and occupancy trends) across asset classes and geographies,” the report said.

Notably, the report also measured institutions’ view of real estate as an investment opportunity from a risk-return standpoint, using a so-called ‘Conviction Index’. After four years of steady declines, this index moved from 4.9 to 5.1.

Interestingly, on the flipside, despite 92 per cent of institutions reporting that they are actively investing in real estate, institutions remain approximately 90 basis points under-invested relative to target allocations, the report found.

One to watch

At AMP Capital, we anticipate the cash rate will continue to fall, potentially as low as 0.25 per cent by early 2020. As a result, we expect the hunt for yields and growth to intensify, as investors search for steady and prolonged sources of income. In this context, real estate will be one to watch as time wears on.


Author: Luke Dixon, Head of Real Estate Research – Real Estate, Sydney, Australia

Source: AMP Capital 10 Oct 2019

Source: https://www.rba.gov.au/media-releases/2019/mr-19-27.html
Source: IPD/MSCI Total Return Digest, Q2, 2019
Source: Cornell/Hodes Weill & PwC
Source: AMP Capital Real Estate Research as at September 2019
Source: https://www.hodesweill.com/research 

Important notes: AMP Capital Funds Management Limited (ABN 15 159 557 721, AFSL 426455) (AMPCFM) is the responsible entity of the Responsible Investment Leaders Balanced Fund (Fund also known as the AMP Capital Ethical Leaders Balanced Fund) (ARSN 095 787 723) (Fund) and the issuer of the units in the Fund. To invest in the Fund, investors will need to obtain the current Product Disclosure Statement (PDS) from AMP Capital Investors Limited (ABN 59 001 777 591, AFSL 232 497) (AMP Capital). The PDS contains important information about investing in the Fund and it is important that investors read the PDS before making a decision about whether to acquire, or continue to hold or dispose of units in the Fund. Neither AMP Capital, AMPCFM nor any other company in the AMP Group guarantees the repayment of capital or the performance of any product or any particular rate of return referred to in this article. Past performance is not a reliable indicator of future performance. While every care has been taken in the preparation of this article, AMP Capital makes no representation or warranty as to the accuracy or completeness of any statement in it including without limitation, any forecasts. This article has been prepared for the purpose of providing general information, without taking account of any particular investor’s objectives, financial situation or needs. Investors should, before making any investment decisions, consider the appropriateness of the information in this article, and seek professional advice, having regard to their objectives, financial situation and needs. This article is solely for the use of the party to whom it is provided and must not be provided to any other person or entity without the express written consent of AMP Capital.

Bridging troubled waters: the pros of investing in infrastructure

Global markets are yet to enter any serious downturns. Still, fragile growth outlooks, high levels of market volatility, record-low interest rates and myriad geopolitical and macroeconomic risks – not least of which is a trade war between the world’s two largest economies – will leave many wondering how they will meet their investment goals in the short to medium term.

The current investment environment is no doubt an uneasy one for many investors. Rather than wait for economic winds to change, investors could instead look to investment classes with outlooks that are less dependent on external and cyclical factors as some others. In this regard, infrastructure investment offers some compelling features in an uncertain climate.


What are some of the benefits of investing in infrastructure?

1.  Consistent returns with lower volatility1  through market cycles

Infrastructure assets are commonly “essential services” assets. This means people have to use them on a day-in and day-out basis. As a result, both utilisation and returns can often be less dependent on the prevailing economic climate than other investments. It is very hard for someone to get through a day without having to use some form (or forms) of essential infrastructure such as electricity, water, gas, schools, hospitals, roads, rail and airports.

In addition, infrastructure assets often benefit from significant barriers to entry in the markets in which they operate. They can have contractual protection from competition by government, while high costs and long lead times for construction provide natural monopolies, and give advance warning and further insurance against new competitive threats to existing revenue streams.

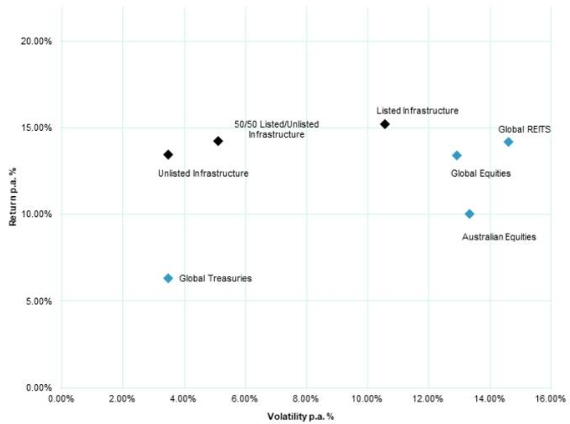
For this reason, returns are often more reliable than those associated with comparable assets outside the sector. Figure 1, below, compares the performance and volatility of infrastructure in various forms, with a range of other asset classes being Australian equities, global equities, global bonds, and global real estate investment trusts (Global REITs). It demonstrates that that over the last 10 years, on an annualised basis, and relative to other asset classes with comparable performance, returns on infrastructure have been delivered with much lower levels of volatility.

Figure 1: Return and volatility of selected asset classes, 10 years to 30 June 2019.3

 
Past performance is not a reliable indicator of future performance.

2. Reliable long-term income yields

Infrastructure asset revenues are often underpinned by regulation or long-term contracts, which provide a high level of visibility of, and certainty around, future cashflows from the asset.

The most obvious example of this in practice occurs with Public Private Partnerships or ‘PPPs’ which are often used by governments to deliver infrastructure projects such as roads, hospitals, schools and public transport systems.

Concessions for assets such as these are often granted over lengthy contractual periods (which can be 30 years or more) and typically offer ‘availability’ revenues, which are paid on the basis that the asset is made available and maintained in a fit state for the intended use, irrespective of the extent to which it is actually used.

For example, in the case of a school of this type, so long as the asset is maintained in a fit state and made available for use, the asset owner gets paid a fixed amount irrespective of the number of students that are enrolled in the school.

Isolation from usage risk in this manner provides a unique level of visibility and security of future revenues from the asset, particularly given that the counterparty responsible for making the availability payments is often a highly creditworthy government body. In addition, infrastructure asset revenues are often linked to inflation, which can help investors protect against the erosion of the value of their investment by inflation over time.

3. Diversification and reduced overall portfolio risk

Overall portfolio diversification is improved when assets have a low level of correlation2 – that is, where assets don’t behave the same way at the same time. The infrastructure asset class, and unlisted infrastructure in particular, has historically demonstrated low levels of correlation with other asset classes, meaning its inclusion in a broader portfolio can be an effective means of reducing overall portfolio risk.

This is illustrated in Figure 2, below, which compares the correlation of various forms of infrastructure investment with a range of other asset classes being Australian equities, global equities, global bonds, and global real estate investment trusts (REITs).

As can be seen, most listed indices are highly correlated with one another, suggesting that even portfolios that were spread across a number of listed asset classes would be poorly diversified. Bonds are negatively correlated with other asset classes, and represent an effective option for diversification, albeit one which traditionally has offered lower long-term returns (see Figure 1.)

Infrastructure, and particularly unlisted infrastructure, displays low correlation with many other asset classes, making it another option for investors wishing to diversify their portfolio, and an attractive one given the historically strong returns illustrated in Figure 1.

Figure 2: Quarterly return correlations for selected asset classes, 10 years to 30 June 2019.3


Past performance is not a reliable indicator of future performance.

Conclusion

Many investors have cottoned on to the benefits of infrastructure, and we expect this to heighten. There is a significant need for new infrastructure in both developed and developing economies. With governments across the globe burdened with high levels of debt, fewer infrastructure projects are likely to be publicly funded. The need for private capital to replace ageing infrastructure or fund new projects will consequently persist over the long term, which we believe will support a broad and growing range of infrastructure investment opportunities.


Author: John Julian, Investment Director – Infrastructure Equity, Sydney, Australia

Source: AMP Capital 10 Oct 2019

Volatility is a means of measuring investment risk. It is a probability measure of the standard deviation of expected returns, and hence can provide a useful comparative measure of the relative risk of different investments over a particular time period.

2 Correlation is another comparative statistical measure. It shows how asset valuations move relative to each other. For example, if assets have a correlation of 1, their values move exactly together. Hence, the addition of assets with a correlation of 1 to a portfolio would provide no diversification benefit. If the correlation was -1, the valuations would move exactly opposite to each other, providing great diversification benefits by lowering the volatility of the portfolio. Interestingly, Figure 1 shows that the volatility of a portfolio of 50% listed and 50% unlisted infrastructure is much lower (~5.5%) than would be expected by simply averaging the volatility of each (~7%). This is because of the low correlation of unlisted infrastructure to listed infrastructure as can be seen in Figure 2 (0.13).

3 Notes to charts:
The charts compare the returns, volatility and correlation of a range of asset classes represented by the indices specified below. Different asset classes will offer different investment features, including differing levels of liquidity.

Unlisted Infrastructure represented by the MSCI Australian Unlisted Infrastructure Index. Listed Infrastructure represented by the Dow Jones Brookfield Global Infrastructure Net Accumulation Index. Global Treasury Bonds represented by Bloomberg Barclays Global Treasury GDP Index. Global Equities represented by the MSCI World Net Accumulation Index. Global REITS represented by the FTSE EPRA NAREIT Developed Rental Net. Australian Equities represented by the S&P/ASX 200 (franking credit adjusted). 50/50 Unlisted/Listed Infrastructure Portfolio represented by a 50% weighting to the MSCI Australian Unlisted Infrastructure Index, and a 50% weighting to the Dow Jones Brookfield Global Infrastructure Net Accumulation Index. All data in AUD. All data is for the period 31 March 2009 to 30 June 2019, except for the FTSE EPRA NAREIT Developed Rental Net index where data is for the period 31 May 2009 to 30 June 2019 (as the data series only began in May 2009).  

Important notes: While every care has been taken in the preparation of this article, AMP Capital Investors Limited (ABN 59 001 777 591, AFSL 232497) and AMP Capital Funds Management Limited (ABN 15 159 557 721, AFSL 426455) (AMP Capital) makes no representations or warranties as to the accuracy or completeness of any statement in it including, without limitation, any forecasts. Past performance is not a reliable indicator of future performance. This article has been prepared for the purpose of providing general information, without taking account of any particular investor’s objectives, financial situation or needs. An investor should, before making any investment decisions, consider the appropriateness of the information in this article, and seek professional advice, having regard to the investor’s objectives, financial situation and needs. This article is solely for the use of the party to whom it is provided and must not be provided to any other person or entity without the express written consent of AMP Capital.

Since I first looked at “Five great charts on investing for income” two years ago, the Australian cash rate has halved, 10-year bond yields have fallen by two thirds and interest rates have resumed falling globally. Ever lower interest rates and periodic turmoil in investment markets provides an ongoing reminder of the importance of the income (cash) flow or yield an investment provides. The environment of low interest rates is challenging for those relying on investment income to fund their living costs and investing for income can seem daunting. So this note looks at five charts I find useful in understanding investing for income.


Chart #1 Alternatives to bank deposits

The income yield an investment provides is basically its annual cash flow divided by the value of the investment.

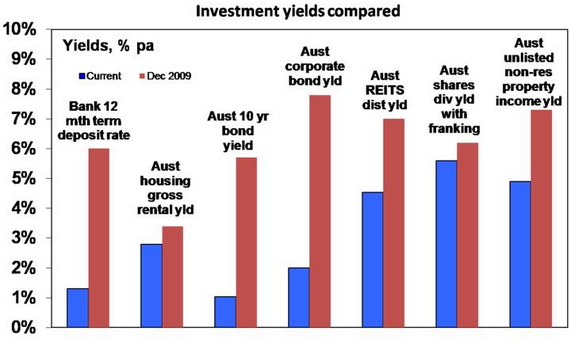
  • For bank deposits, the yield is simply the interest rate, eg bank 1-year term deposit rates in Australia are about 1.3% and so this is the cash flow they will yield in the year ahead.

  • For ten-year Australian Government bonds, annual cash payments on the bonds (coupons) relative to the current price of the bonds provides a yield of 1% right now.

  • For corporate debt, it’s a margin above government bond yields and depends on the riskiness of the company but is currently averaging around 2% in Australia.

  • For residential property, the yield is the annual value of rents as a percentage of the value of the property. On average in Australian capital cities it is about 4.2% for apartments and around 2.8% for houses. After allowing for costs, net rental yields are about 2 percentage points lower. 

  • For unlisted commercial property, yields are around 4.9%.

  • For infrastructure investment it averages around 4%, but franking credits could add 0.45% to this.

  • For a basket of Australian shares represented by the ASX 200 index, annual dividend payments are running around 4.3% of the value of the shares. Once franking credits are allowed for, this pushes up to around 5.6%.

The next chart shows the yield available on a range of investments both now and in December 2009 for comparison.


Source: Bloomberg, REIA, RBA, JLL, AMP Capital

Key messages: First, the yield on bank deposits and government bonds is woeful. Second, there are alternatives to cash when it comes to yield or income, notably shares, property and infrastructure but even here yields have generally trended down (albeit less so for shares). Of course, investors need to allow for risk. Bank deposits have close to zero risk but any move to higher-yielding investments does entail taking on risk.

Chart #2 The gap between yields on different assets provides a guide to value

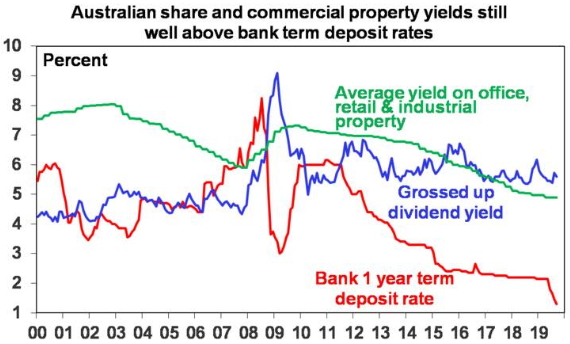
The next chart shows average yields on Australian shares and unlisted commercial property relative to the one-year term deposit rate since 2000. With share and property yields not plunging to the degree bank deposit rates have, the gap between the former and latter is extremely wide. In fact, the share yield is in its historic range. All things equal, this suggests commercial property and Australian shares continue to provide better value. The same applies to unlisted infrastructure.


Source: JLL, Bloomberg, AMP Capital

Key message: comparing yields provides a guide to relative value, and shares and unlisted commercial property remain very attractive relative to bank deposits.

Chart #3 Shares can provide stronger growth in income with less volatility than bank deposits

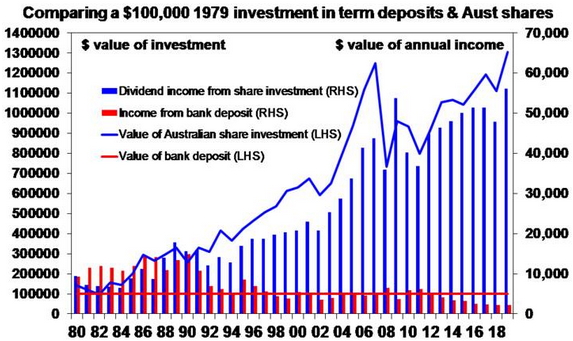
Investing in shares entails the risk of capital loss, but can offer a higher and less volatile income flow over time. The next chart compares initial $100,000 investments in Australian shares (ASX 200) and one-year term deposits in December 1979 and the income they have provided over time (before franking credits are allowed for in the case of shares).


2019 data is year to date/annualised. Source: RBA, Bloomberg, AMP Capital

The term deposit would still be worth $100,000 (red line) and last year would have paid roughly $2200 in interest (red bars). By contrast the $100,000 invested in shares would have grown to $1.31 million (blue line) now and last year would have paid $47,792 in dividends before franking credits (blue bars). The point is that dividends tend to grow over time (because profits and hence an investment in shares tends to rise in value) and are relatively stable compared to income from bank deposits, which vary with interest rate settings. Over the period the worst decline in dividend income from shares was a 32% decline between 2009 and 2011, whereas the income from bank deposits plunged 68% between 1990 and 1994 and by 65% between 2011 and this year. And it’s set to plunge even more given the falls in term deposit rates since June. Once franking credits are allowed for, the comparison would become even more favourable towards shares.

Key message: shares come with the risk of capital loss, but a well-diversified portfolio of Australian shares can provide stronger growth in income with less volatility in that income than bank term deposits. The key question investors focused on income (or cash flow) need to ask is what is most important: stability in the value of their investment or a higher, more sustainable income flow than bank deposits offer? But if investors do go down the share path, it’s critical to have a well-diversified portfolio of shares paying high and sustainable dividend yields. Look for stocks that have a reliable track record of growing those dividends and that have dividends that are not threatened by things like excessive gearing.

Chart #4 A bird in the hand is worth two in the bush

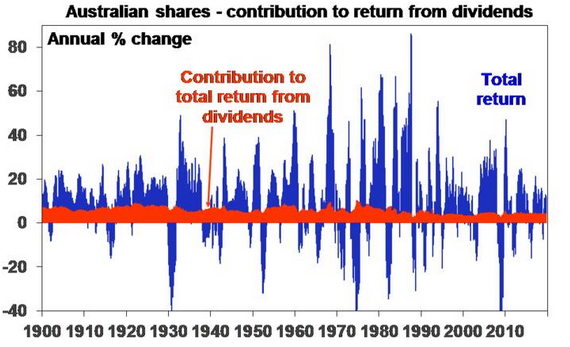
A high and sustainable starting point yield provides some security during volatile times. Since 1900, dividends (prior to allowing for franking credits) have provided just over half of the 11.8% average annual return from Australian shares and as can be seen in the next chart their contribution has been stable in contrast to the capital value of shares.


Source: Global Financial Data, Bloomberg, AMP Capital

Dividends are relatively smooth over time because most companies hate having to cut them as they know it annoys shareholders, so they prefer to keep them sustainable.

Key message: a high and sustainable income yield for an investment provides some security during volatile times. It’s a bit like a down payment on future returns.

Chart 5 Yield provides a guide to future returns

The income yield an investment provides is a key building block in its total return, which is determined by the following.

Total return = yield + capital growth

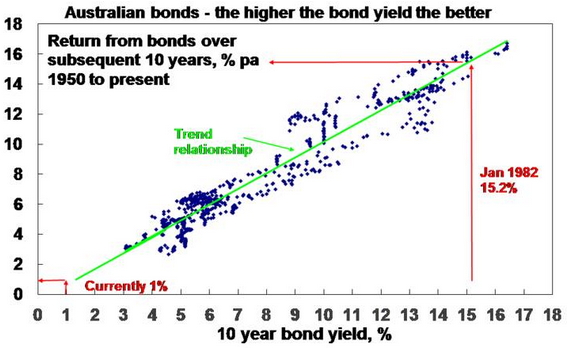
Generally speaking, the higher the yield an investor invests at, the higher the return their investment will likely provide. This is self-evident in the case of bank deposits because the yield is the return (assuming the bank does not default on its deposits – which is very unlikely in Australia given government protections). It can be seen in relation to bonds in the next chart, which shows a scatter plot of Australian ten-year bond yields since 1950 (along the horizontal axis) against subsequent ten-year bond returns based on the Composite All Maturities Bond Index (vertical axis). Over short-term periods, bond prices can move up and down and so influence short-term returns, but over the medium term the main driver of the return a bond investor will get is what bond yields were when they invested. If the yield on a ten-year bond is 5%, then if you hold the bond to maturity your return will be 5%. Of course, a portfolio of bonds will reflect a range of maturities and so the relationship is not perfect, but it can be seen in the next chart that the higher the starting point bond yield, the higher the subsequent return.


Source: Global Financial Data, Bloomberg, AMP Capital

When bond yields are high, they drive high bond returns over the medium term and vice versa. For example, when Australian ten-year bond yields in January 1982 were 15.2% it’s not surprising that returns from bonds over the subsequent ten years were 15.4% per annum. Similarly, when bond yields were just 3.1% in January 1950, it’s no surprise that returns from bonds over the next ten years were 3.1%. At 1% now, we are off (the bottom of) the chart meaning record low bond returns for the next decade.

Similar, albeit less perfect, relationships exist for other asset classes – the higher the yield, the higher the subsequent return.

As always, there are some risks investors must watch out for. At the individual share level, a very high dividend yield may be a sign of a “value trap” – where current profits and dividends may be fine but there is an impending threat to the company and so the share price is low. Second, high distributions may also be unsustainable if they are being paid for out of debt and reflect excessive gearing or high-risk investments. There is no free lunch.

Key message: while returns have been solid lately, low investment yields do warn of lower returns ahead – most notably from government bonds.


Author: Dr Shane Oliver, Head of Investment Strategy and Economics and Chief Economist, AMP Capital Sydney, Australia

Source: AMP Capital 15 Oct 2019

Important notes: While every care has been taken in the preparation of this article, AMP Capital Investors Limited (ABN 59 001 777 591, AFSL 232497) and AMP Capital Funds Management Limited (ABN 15 159 557 721, AFSL 426455) (AMP Capital) makes no representations or warranties as to the accuracy or completeness of any statement in it including, without limitation, any forecasts. Past performance is not a reliable indicator of future performance. This article has been prepared for the purpose of providing general information, without taking account of any particular investor’s objectives, financial situation or needs. An investor should, before making any investment decisions, consider the appropriateness of the information in this article, and seek professional advice, having regard to the investor’s objectives, financial situation and needs. This article is solely for the use of the party to whom it is provided and must not be provided to any other person or entity without the express written consent of AMP Capital.

By Emily Woodland

Co-Head of Sustainable InvestmentHong Kong, China

Impact investing has become much more sophisticated, as funds in this asset class start to develop more meaningful ways of measuring their outcomes. Global investors’ growing commitment to frameworks such as the UN’s Sustainable Development Goals (SDGs) are also helping increase exposure to and discussion around this still relatively niche investment area.

This style of investing was the focus of a recent AMP Capital roundtable, involving leading fund managers in this area, as well as a host of other experts in this field.

Investment opportunities

Impact investors aim to deploy capital in a way that creates positive social and/or environmental effects, in addition to a financial return.

Although impact investing is asset-class agnostic, according to a survey published by the Global Impact Investing Network (GIIN)1, on average 41 per cent of impact investors’ capital is currently invested in private debt and 18 per cent in private equity. While the tides are slowly turning, this is largely due to the fact it’s still more difficult to find pure-play companies in impact investing in public markets.

Additionally, there tends to be more opportunities for impact investments in developing and emerging markets, rather than developed markets. This is because far more capital is required in developing markets to achieve a real social impact, compared to developing markets.

One example discussed at the roundtable was the Newpin Social Benefit Bond, which is funding the expansion of the Newpin program, run by Uniting Care Burnside. The A$7 million bond aims to reduce the number of children needing to enter foster care, and support those currently in foster care to return to their families. Designed to achieve specific outcomes, it also includes capital guarantees, while returns depend on children being able to stay with their families on a permanent basis.

The bond aims to achieve a 60 to 65 per cent success rate in terms of children going back to their families, and a return of between 8 per cent and 12 per cent a year. So far, it has achieved a return of 12.2 per cent and 130 children have been reunited with their families.

Challenges of impact investing

One of the challenges of impact investing discussed was how to measure success. Environmental impacts tend to be easier to measure than social impacts because there is more common quantifiable data, such as the amount of CO2 emissions avoided, or the number of gigawatts of renewable energy produced. Social impacts, on the other hand, may include the number of affordable homes provided or dollar savings achieved by the government.

However, it’s difficult to attain consistency of measurement across different investments because of the vast array of impacts, a lack of commonality and difficulty in quantifying and comparing impact. Currently, the 17 SDGs are the most commonly used impact performance measurement tool, where investors assign impact to one or more of the goals, such as climate action or gender equality. The Impact Management Project is also being commended as another potential solution for impact reporting frameworks.

Similarly, getting the balance right between delivering a strong return to investors and ensuring the community or issue the investors are attempting to resolve receives adequate funding, is another obstacle impact investing is currently navigating.

In short, it is absolutely possible to achieve competitive returns. The Responsible Investment Association of Australia2  recently found that investor experience in Australia has largely been in line with their expectation for market returns. Globally, The GIIN1 2018 Annual Investor Survey found that the majority of respondents reported performance in line with both impact (82%) and financial (76%) expectations (where financial targets were mostly risk-adjusted, market-rate returns). 15% even experienced outperformance versus expectations in terms of both impact and financial returns.

Despite these encouraging findings, it is still proving difficult to draw meaningful conclusions about impact investment performance, due to a lack of available data over the short history of the industry, and lack of clarity over the appropriate definition of market return or benchmark in these instances.

Overall, we believe there are plenty of opportunities for impact investors to improve and refine the way capital is allocated and returns are measured. It appears that the sector is moving in the right direction to achieve these aims, for the benefit of groups that require funds to tackle social and other global issues, and the communities in which they are focused.

Please contact us on Phone: 07 5641 4134 if you seek further assistance on this topic .

1Global Impact Investing Network. See https://thegiin.org/assets/2018_GIIN_Annual_Impact_Investor_Survey_webfile.pdf

2RIAA is the Responsible Investment Association of Australia, the peak body for impact investing advocacy in Australia, see https://responsibleinvestment.org/about-us/ for further information. Impact Investing is a relatively immature but rapidly growing industry, so there is limited information available on actual investments and their financial and impact performance outside of RIAA’s work. In this article, unless otherwise stated, we have sourced all data from the RIAA Benchmarking Impact – Australian Impact Investment Activity and Performance Report 2018

Source : AMP Capital June 2019 

 Important notes: While every care has been taken in the preparation of this article, AMP Capital Investors Limited (ABN 59 001 777 591, AFSL 232497) and AMP Capital Funds Management Limited (ABN 15 159 557 721, AFSL 426455)  (AMP Capital) makes no representations or warranties as to the accuracy or completeness of any statement in it including, without limitation, any forecasts. Past performance is not a reliable indicator of future performance. This article has been prepared for the purpose of providing general information, without taking account of any particular investor’s objectives, financial situation or needs. An investor should, before making any investment decisions, consider the appropriateness of the information in this article, and seek professional advice, having regard to the investor’s objectives, financial situation and needs. This article is solely for the use of the party to whom it is provided and must not be provided to any other person or entity without the express written consent of AMP Capital.

Information overload is a modern day problem.

Between smartphones, websites and watches that alert you even when you have ignored the phone, it is hard, if not impossible, to tune out the noise of the world. Trade wars, Brexit, currency slumps, geopolitical tensions are just the headlines that can dominate the news cycle on any given day at the moment. Thankfully the Australian cricket team provided some welcome relief – and restored a little national pride – at Edgbaston.

Vanguard has been publishing its annual index chart that plots the performance of all the major markets and asset class indices for Australian investors for 18 years. It allows investors to look at how markets have rewarded them for the risk they have taken through periods of market rises and periodic slumps.

This year’s chart provides the data to June 30 2019, and naturally there is always a tendency to focus on what has topped the performance table – US shares at 10.3 per cent per annum is the answer – and while interesting, that is not the key message from the chart.

The core message – and the reason for continuing to publish it over such an extended period of time – is to understand the power of markets over the long-term.

Think of a major event that roiled investment markets and look at that point on the chart – the last Australian recession in 1992 or the collapse of Lehman Bros, for example, in 2008 – to understand its impact at the time. Then zoom out to see how it affected returns over the full 30-year time period covered by the chart.

The other message provided by the index chart that is sometimes lost in translation is when investors lean towards wanting to predict what will be the top performing asset class next year… and the year after that.

You can view the digital version of the chart here (or order a print copy here) but if you are tempted to try and time markets, it’s worth taking a look at page four of the index chart brochure which has a table of the total returns across all the major asset classes featured in the chart.

The best and worst performing asset classes are highlighted across each year – and feel free to let us know if you spot a performance pattern because what we see is what Burton Malkiel captured so elegantly in his investment classic, A Random Walk Down Wall Street.

The index chart shows the performance of markets over the long-term, but for individual investors its value is in understanding how you blend all of those markets to create a portfolio with the right asset allocation to achieve your investment goals within a risk level that you are comfortable with.

For investors a sense of perspective is a critical tool in the armory that can help tune out short-term noise, focus on your long-term goals and, as the legendary founder of Vanguard, Jack Bogle said, help you to “stay the course”. 


Please contact us on Phone: 07 5641 4134 if you would seek further discussion on this topic.

Source : Vanguard August 2019 

Written by Robin Bowerman, Head of Corporate Affairs at Vanguard.

Reproduced with permission of Vanguard Investments Australia Ltd

Vanguard Investments Australia Ltd (ABN 72 072 881 086 / AFS Licence 227263) is the product issuer. We have not taken yours and your clients’ circumstances into account when preparing this material so it may not be applicable to the particular situation you are considering. You should consider your circumstances and our Product Disclosure Statement (PDS) or Prospectus before making any investment decision. You can access our PDS or Prospectus online or by calling us. This material was prepared in good faith and we accept no liability for any errors or omissions. Past performance is not an indication of future performance.

© 2019 Vanguard Investments Australia Ltd. All rights reserved.

Important:
Any information provided by the author detailed above is separate and external to our business and our Licensee. Neither our business nor our Licensee takes any responsibility for any action or any service provided by the author.

Any links have been provided with permission for information purposes only and will take you to external websites, which are not connected to our company in any way. Note: Our company does not endorse and is not responsible for the accuracy of the contents/information contained within the linked site(s) accessible from this page.